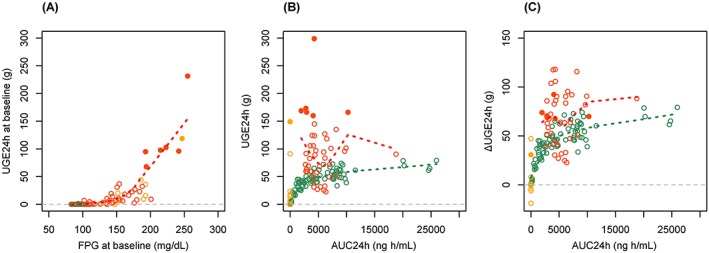
Figure 1.

Scatter plots of A, baseline change in urinary glucose excretion for 24 hours (ΔUGE24h) vs fasting plasma glucose (FPG), B, absolute UGE24h vs area under the concentration–time curve from time of dosing to 24 h after administration (AUC24h) and C, ΔUGE24h vs area under the concentration–time curve from time of dosing to 24 h after administration AUC24h. Green circles: healthy subjects (ipragliflozin), black circles: healthy subjects (placebo), red circles: type 2 diabetes mellitus (T2DM) patients (ipragliflozin), yellow circles: T2DM patients (placebo), filled circles: patients with significantly high baseline UGE24h (>50 g), green dotted line: locally weighted scatterplot smoothing line in healthy subjects (ipragliflozin), red dotted line: locally weighted scatterplot smoothing line in T2DM patients (ipragliflozin).
