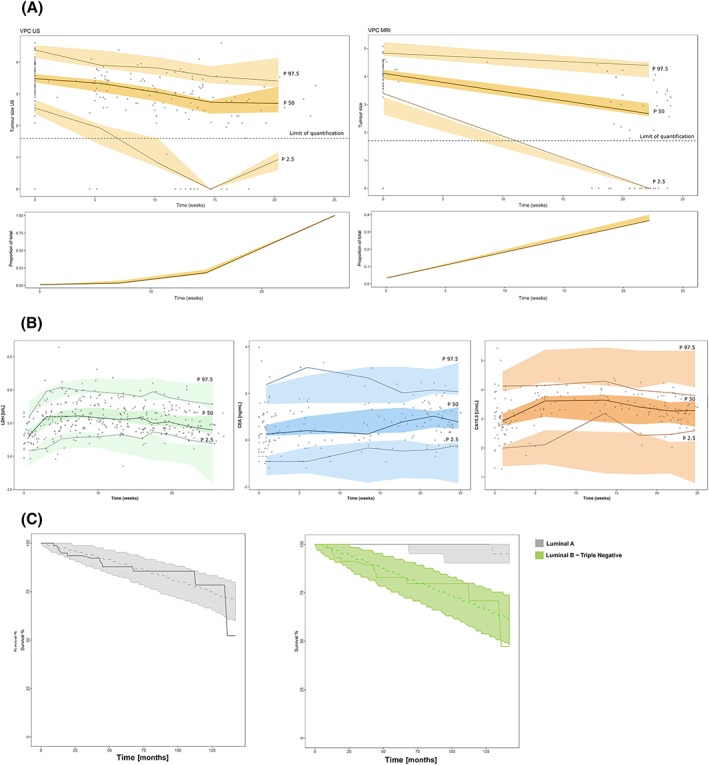
Figure 3.

Results from simulation‐based model evaluation. (A, B upper panels) Points in black represent raw data, and coloured shaded areas represent the 95% confidence intervals of the 2.5th, 50th and 97.5th percentiles obtained from 500 simulated datasets. A, Shows the tumour size assessed by ultrasound (US; left panel) and magnetic resonance imaging (right panel). The lower panels show the percentage of the below limit of quantification values. The solid line represents the observed proportion of below the limit of quantification values and the area is the 95% confidence interval predicted by the model. B, Biomarker prediction‐corrected visual predictive checks for lactate dehydrogenase, carcinoembryonic antigen and carcinoma antigen 15–3 (left to right). C, Kaplan–Meier curves for the progression‐free survival (PFS); the solid line represents the raw PFS profile and shaded areas cover the 95% confidence intervals of the model based simulated PFS profiles
