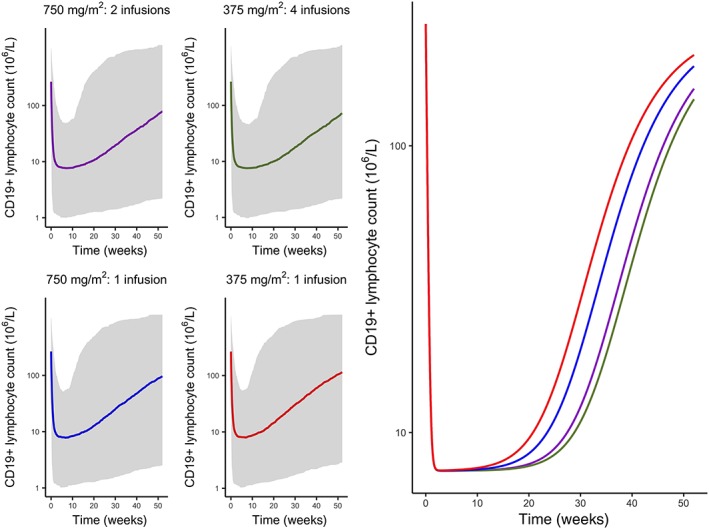
Figure 4.

Simulated profiles of suppression of CD19+ lymphocytes after variable dosing regimens of rituximab (purple: 2 infusions of 750 mg/m2 given 2 weeks apart, green: four weekly infusions of 375 mg/m2, blue: a single infusion of 750 mg/m2, red: a single infusion of 375 mg/m2, grey band: 95% prediction interval)
