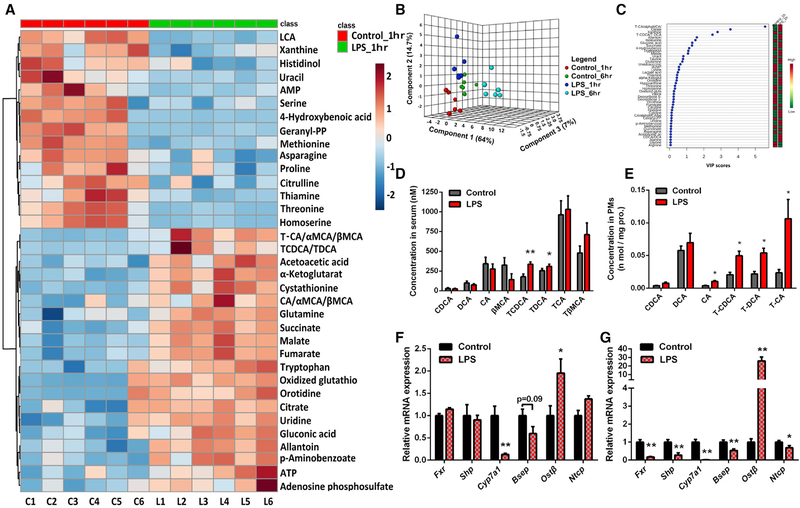
Figure 1. Bile Acids Are Altered in LPS-Induced Sepsis.
(A) Heatmap illustrating serum metabolite profiles in mice 1 hr after LPS treatment; the top 35 metabolite features were ranked by t test, distance measure was by Pearson correlation, and clustering was determined using the Ward algorithm. C1–C6 represents control mice and L1–L6 represents LPS-treated mice.
(B) Three-dimensional principal component analysis (3D-PCA) of serum metabolome containing, overall, 77 markers 1 hr and 6 hr after LPS treatment in mice.
(C) Variable importance in projection (VIP) plot identified by partial least squares discriminant analysis (PLS-DA) displaying the top 45 most important metabolite features in mice after 1 hr of LPS treatment.
(D and E) Levels of the main bile acid species in serum (D) and PMs(E) in mice after 6 hr of LPS treatment determined by high-performance liquid chromatography-quadrupole time-of-flight tandem mass spectrometry (HPLC-triple/TOF-MS); data of PMs were normalized by protein concentrations.
(F and G) mRNA levels of FXR and bile acid transporters in the liver of mice after 1 (F) or 6 hr(G)of LPS treatment; Gapdh mRNA was used as internal control (n = 6).
Data are representative of two independent experiments and shown as mean ± SEM of six mice, **p < 0.01, *p < 0.05; two-tailed Student’s t tests.
See also Figure S1.

