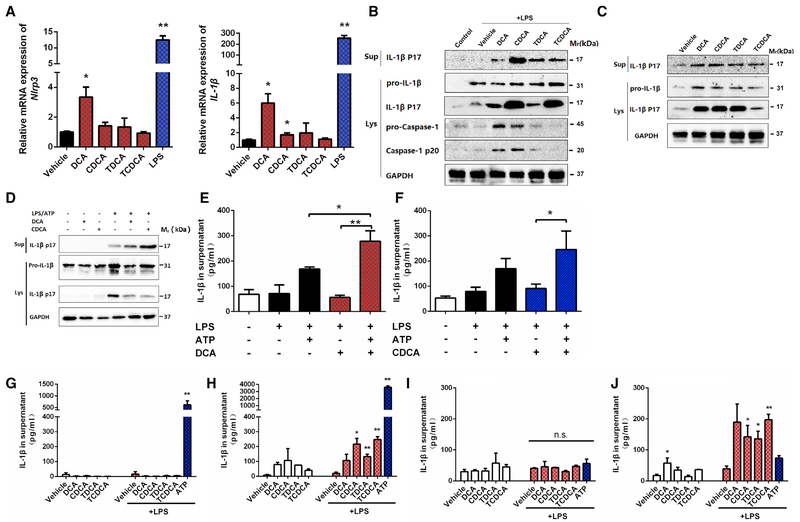
Figure 2. Bile Acids Activate Both Signal 1 and 2 of the NLRP3 Inflammasome.
(A-C) Bile acid activation of the NLRP3 inflammasome in PMs. Relative expression of Nlrp3 and Il-1β mRNAs (A). PMs were stimulated with 50 μM bile acids or 50 ng/mL LPS for 4 hr. Western blot analysis of caspase 1 and IL-1β in cells with (B) or without (C) LPS priming at 50 ng/mL for 2 hr. The concentration for all bile acids tested is 50 μM.
(D-F) Synergistic effects of bile acids and ATP as assessed by western blot (D) and ELISA (E and F). LPS-primed PMs were stimulated with 25 μM bile acids for 4 hr with or without 0.5 mM ATP, which was spiked for 30 min.
(G-J) ELISA analysis of IL-1β in BM D M s and peripheral blood mononuclear cells (PBMCs). Freshly prepared BM D M s (G) or differentiated BM D M s (H) were stimulated with bile acids (50 μM) for 4 hr, with or without LPS (500 ng/mL) priming for 2 hr. Human PBMCs (I) or human PBMC differentiated macrophages (J) were stimulated with bile acids (50 μM) for 4 hr, with or without LPS (500 ng/mL) priming for 2 hr. A total of 2 mM ATP treatment for 30 min was used as the positive control.
GAPDH was used as internal standard/loading control in qPCR/immunoblot analyses. Data are representative of at least two independent experiments and expressed as mean ± SEM (n = 3). **p < 0.01, *p < 0.05 compared to control unless indicated otherwise; two-tailed Student’s t test.
See also Figure S2.

