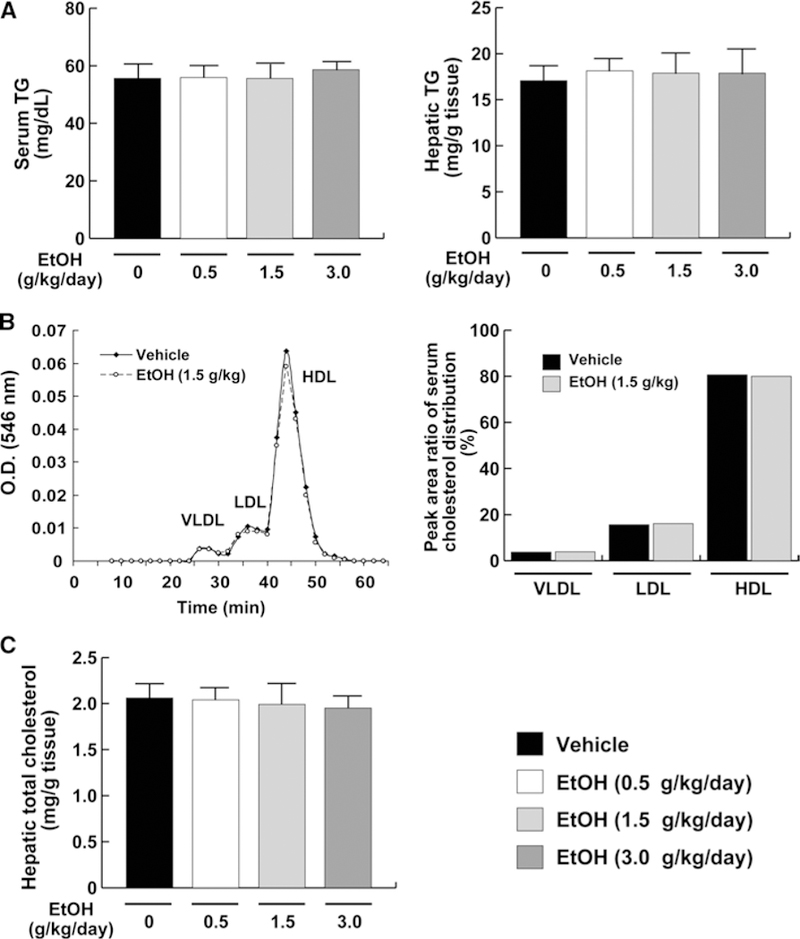
Fig. 2.

Serum and liver cholesterol/TG levels in mice receiving ethanol treatment. a Serum/liver TG levels. b Representative cholesterol profile composed of very low-density Lipoprotein (VLDL), low-density lipoprotein (LDL), and high-density lipoprotein (HDL) and the peak area ratio of the serum cholesterol distribution. c Hepatic total cholesterol levels. Data for (a) and (c) are expressed as mean ± SD. Data for (b) are expressed as mean. Vehicle, vehicle group (n = 6); EtOH (0.5 g/kg/day), low-dose ethanol treatment group (n = 6); EtOH (1.5 g/kg/day), middle- dose ethanol treatment group (n = 6); EtOH (3.0 g/kg/day), high-dose ethanol treatment group (n = 6)
