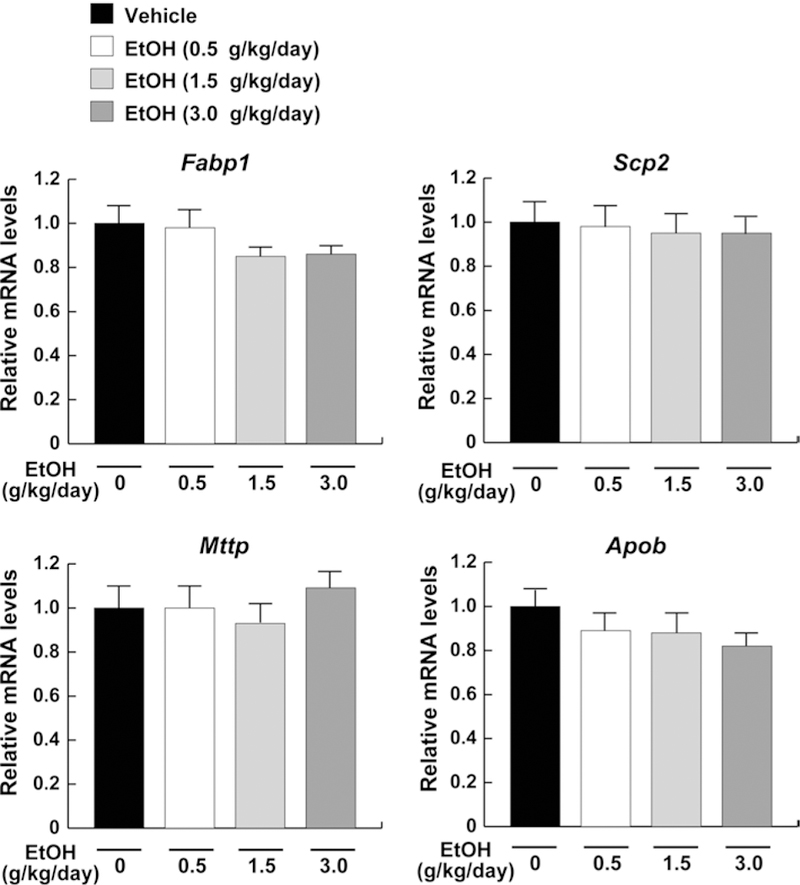
Fig. 4.

Expression of the genes associated with lipid transport in mice receiving ethanol treatment. Hepatic mRNA levels encoding Fabp1, Scp2, Mttp, and Apob were measured using quantitative real-time PCR and normalized to those of Gapdh mRNA. Relative mRNA levels are shown as fold changes to that of mice in the vehicle group. Data are expressed as mean ± SD. The groups and numbers of mice were the same as Fig. 2
