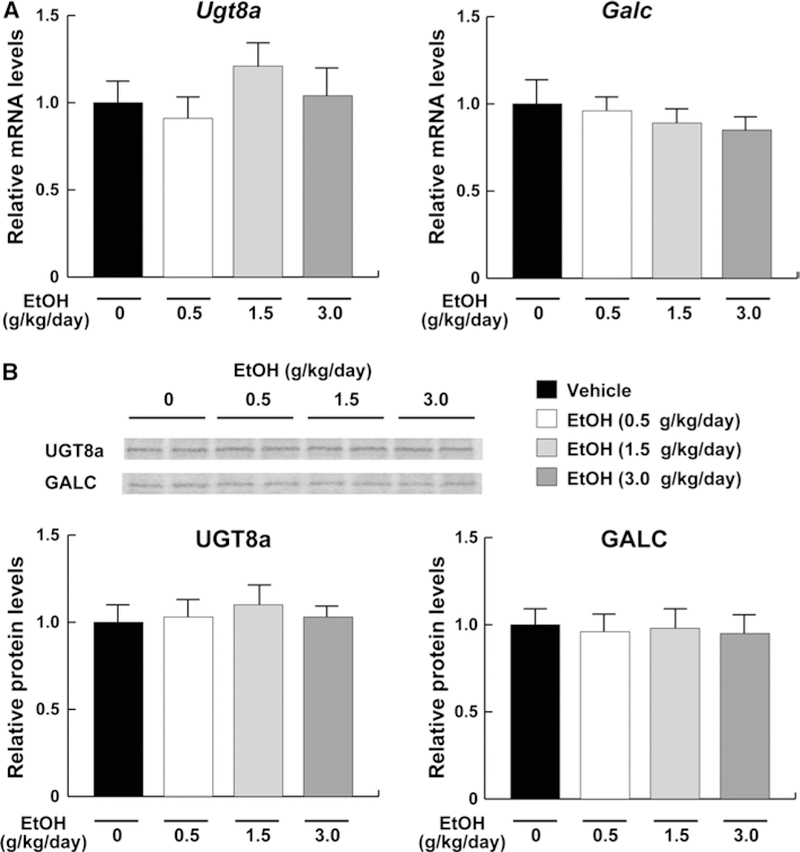
Fig. 6.

Hepatic expression of the enzymes involved in galactosylceramide metabolism in mice receiving ethanol treatment. a The mRNA levels encoding Ugt8a and Galc. The same samples in Fig. 4 were used. b Immunoblot analysis of UGT8a and GALC. The same samples in Fig. 5b (50 μg of protein) were used. Band intensities were measured densitometrically, normalized to those of actin, and then normalized to hepatic levels of mice in the vehicle group. Data are expressed as mean ± SD. The groups and numbers of mice were the same as Fig. 2
