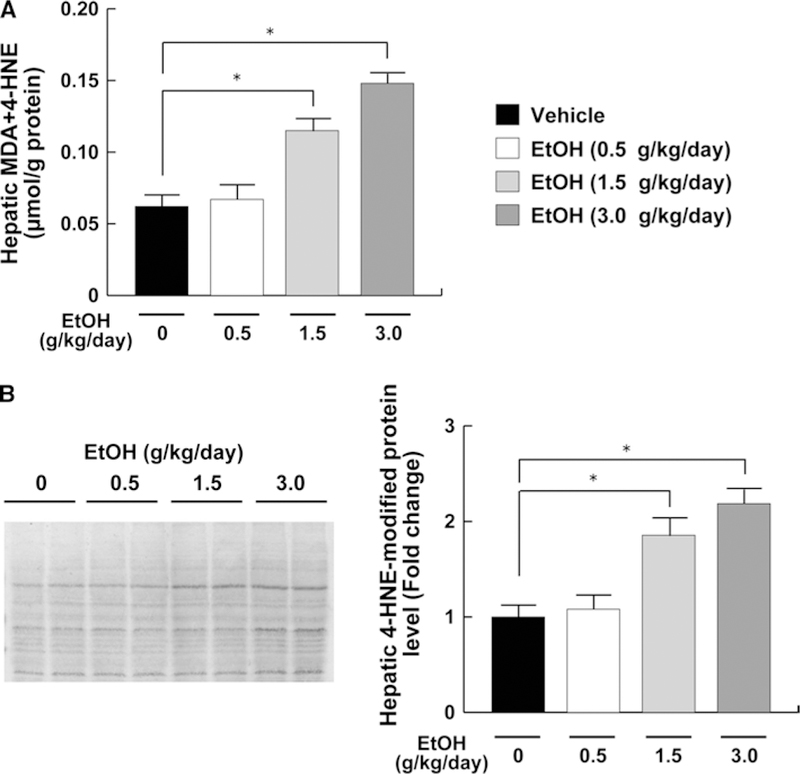
Fig. 7.

Hepatic oxidative stress in mice receiving ethanol treatment. a Hepatic contents of Lipid peroxides. b Immunoblot analysis of 4-HNE. The same samples in Fig. 5b (50 μg of protein) were used. Band intensities were measured densitometrically, normalized to those of actin, and then normalized to hepatic levels of mice in the vehicle group. The groups and numbers of mice were the same as Fig. 2. *P < 0.05 between the vehicle and indicated ethanol treatment groups
