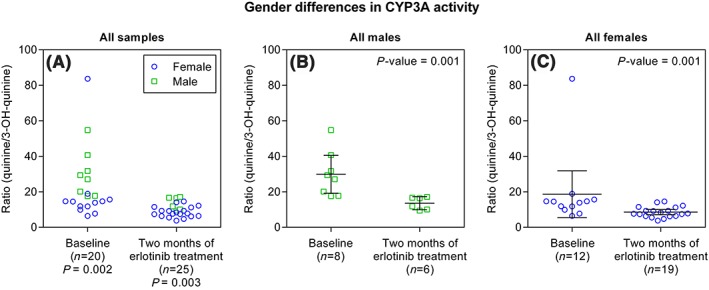
Figure 2.

Illustration of gender differences in CYP3A activity based on the entire study population where (A) females show lower quinine/3‐OH‐quinine ratio compared to males at baseline and after 2 months of erlotinib treatment. When all patients are subdivided based on gender, into (B) males and (C) females, the statistically significant decrease in quinine/3‐OH‐quinine ratios between samples obtained at baseline and at 2 months of treatments is maintained
