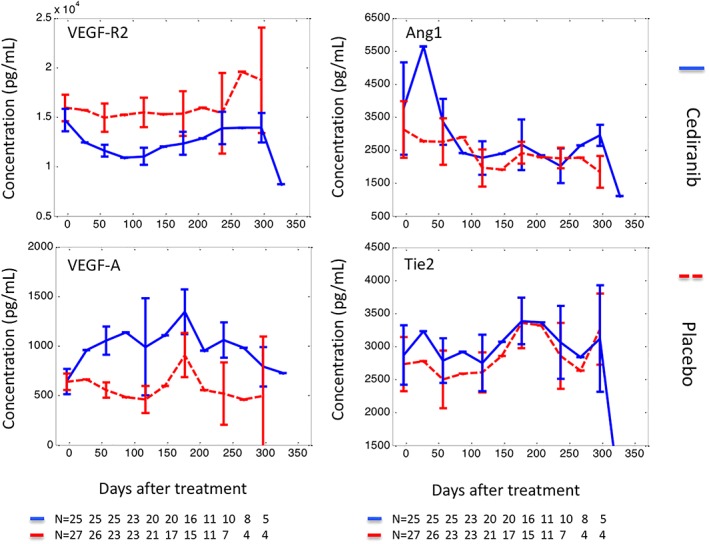
Figure 1.

Concentrations of circulating biomarkers during treatment. Biomarker concentrations, measured before treatment, during treatment and up to the point of diagnosis of progressive disease, were plotted against treatment time. The data are presented as median ± standard error, with solid lines representing biomarkers measured in the cediranib arm and dashed lines biomarkers measured in the control arm
