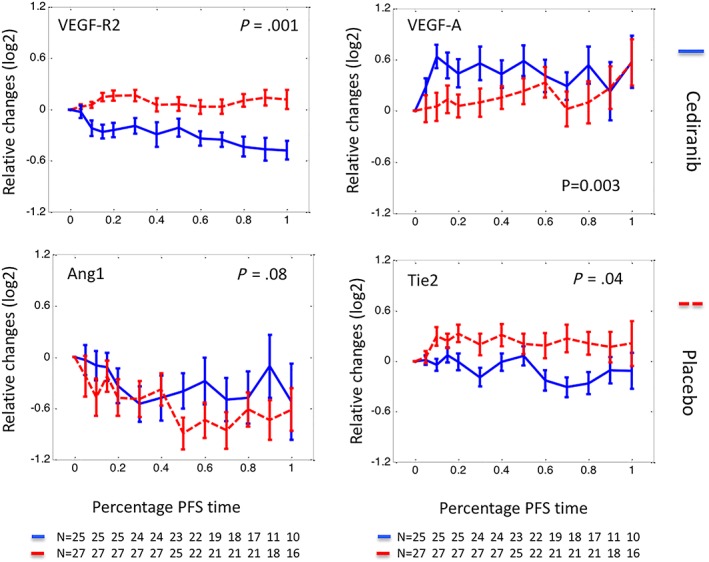
Figure 2.

Relative changes of circulating biomarkers normalised by progression‐free survival (PFS). Relative changes of biomarkers were plotted against the percentage of PFS interval (%PFS). Here relative changes of a biomarker at a given time were defined as a log2 transformed ratio between biomarker concentration measured at the time and that measured prior to‐treatment. Plotting in relative changes reduced the pretreatment biomarker variation between different arms, most notably in Ang1 and Tie2. The %PFS interval was defined as elapsed treatment time divided by the length of PFS. A %PFS of 0 represents the start of treatment and 100 represents the diagnosis of PD or censoring. Using a %PFS scale allows biomarkers from patients with different PFS intervals to be compared, especially at the later phase of treatment. The data are presented as median ± standard error, with solid lines representing biomarkers measured in the cediranib arm and dashed lines biomarkers measured in the control arm
