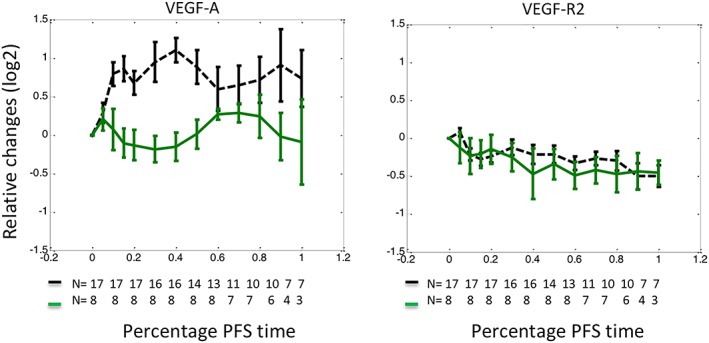
Figure 3.

Heterogeneity of vascular endothelial growth factor (VEGF)‐A response to cediranib. An unsupervised clustering analysis dichotomised patients treated with cediranib into 2 cohorts with distinct patterns of VEGF‐A changes. Patients represented by the green solid curve demonstrated moderate changes resembling those treated with standard chemotherapy. In contrast, patients illustrated with the black dashed curve demonstrated significant elevation following cediranib. In these figures, relative changes of biomarkers were plotted against the percentage of progression‐free survival interval (%PFS). Relative changes of a biomarker at a given time were defined as a log2 transformed ratio between biomarker concentration measured at the time and that measured prior to‐treatment. The %PFS interval was defined as elapsed treatment time divided by the length of PFS. VEGF‐receptor 2 (R2) demonstrated little difference on the same clusters of patients, indicating that the difference in VEGF‐A elevation was not caused by VEGF‐R2. The data are presented as median ± standard error
