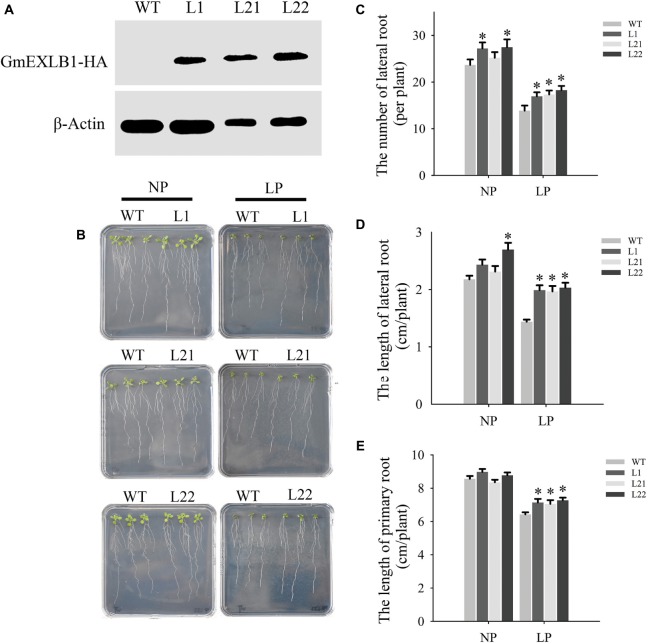
Figure 7.
Root phenotypic analysis of transgenic Arabidopsis with GmEXLB1 overexpression. (A) Western blotting of transgenic and wild-type plants. WT: wild-type plant. L1, L21, and L22: three transgenic lines. (B) Root phenotype observed on agar with NP and LP. (C) The number of lateral roots in transgenic and wild-type plants under NP and LP conditions. The data are the mean ± SE (n = 5). Error bars represent the SE. Asterisks indicate that the values are significantly different (p < 0.05). (D) The lateral root lengths in transgenic and wild-type plants under NP and LP conditions. The data are the mean ± SE (n = 5). Error bars represent the SE. Asterisks indicate that the values are significantly different (p < 0.05). (E) The primary root length in transgenic and wild-type plants under NP and LP conditions. The data are the mean ± SE (n = 5). Error bars represent the SE. Asterisks indicate that the values are significantly different (p < 0.05).

