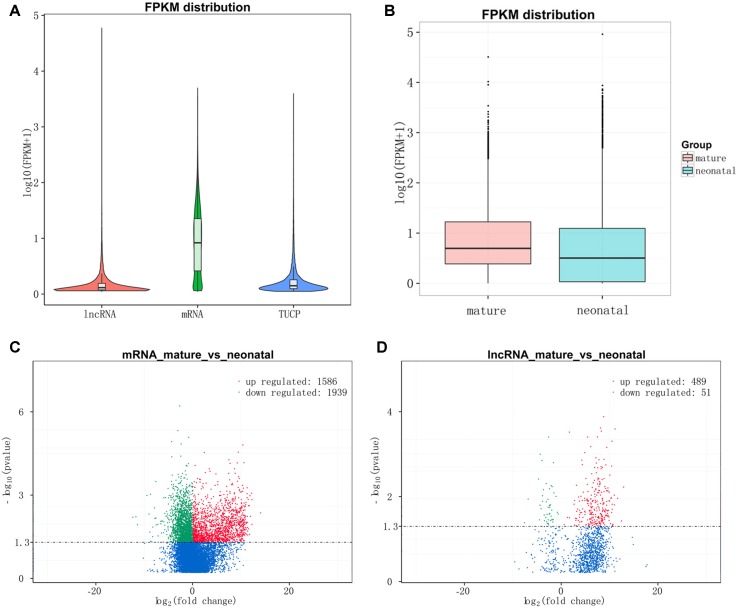
Figure 4.
Expression levels of lncRNAs and protein-coding genes. (A) The expression level of lncRNAs, mRNAs, and TUPC based on log10(FPKM+1). (B) Box plots of lncRNAs, protein-coding genes, and TUPC expression level (log 10 FPKM+1) of neonatal and mature testes group. (C) Differential mRNA expression between neonatal and mature bovine testis. (D) Differential lncRNA expression between neonatal and mature bovine testis. Volcano plots showed –log10 (P value) versus log2 (fold change) difference in mRNA and lncRNA abundance in FPKMs between neonatal and mature cattle testis. Red circles denoted significantly up-regulated lncRNAs, whereas green circles denoted significantly downregulated lncRNAs (P < 0.05).

