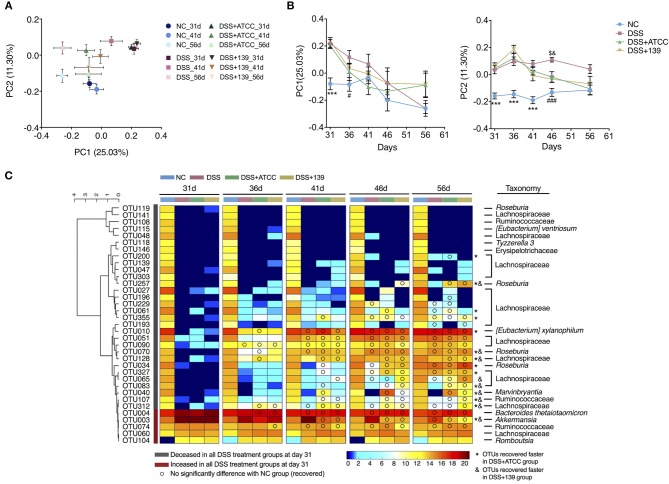
Figure 5.
Modulation of gut microbiota by DSS treatment or by DSS treatment and the two strains of A. muciniphila. (A) Bray-Curtis PCoA plot of day 31, 41, and 56 based on OTU abundance. (B) Variation of gut microbiota structure on PC1 and PC2 based on Bray-Curtis distance, n = 10 for each group before the 46 day time point, n = 5 for each group. Data are shown as means ± s.e.m. Values of each group were calculated by one-way analysis of variance (ANOVA) followed by Tukey's post-hoc test. ***P < 0.001 compared to all three groups treated with DSS, ###P < 0.001 compared to the DSS group, $P < 0.05 compared to the DSS+ATCC group, &P < 0.05 compared to the DSS+139 group. (C) Heat map of 35 OTUs after DSS treatment during the alleviation period of mouse colitis. The color of the spots in the panel represent the mean relative abundance (log-transformed) of the OTUs in each group. The OTUs are clustered according to the Spearman correlation coefficient, n = 10 for each group before the 46 day time point, n = 5 for each group. The relative abundance of each DSS-treated group was compared to the NC group by Mann-Whitney U test. Compared to the relative abundance of the NC group at day 31, the taxonomy of OTUs increased significantly in all DSS-treated groups colored red, decreased significantly in all DSS-treated groups colored gray. OTUs recovered faster in mice gavaged with strain ATCC and are marked with *. OTUs recovered faster in mice gavaged with strain ATCC and are marked with &.

