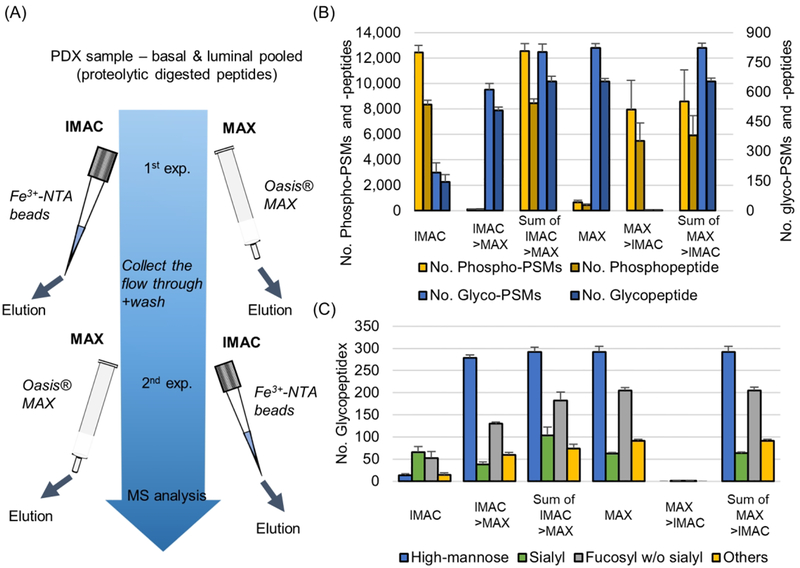
Figure 3.
Performances of the two workflows for phosphoproteomic and glycoproteomic analyses. (A) Illustration of the workflow for phosphopeptide and IGPs enrichments using IMAC and MAX. The second enrichment was performed using the flow through from the first one.(B) The numbers of identified phosphopeptides (left y-axis) and IGPs (right y-axis) across two experimental workflows. (C) Glycan profile distribution for identified IGPs. “Sialyl” means sialylated glycopeptide with or without fucosylated form.

