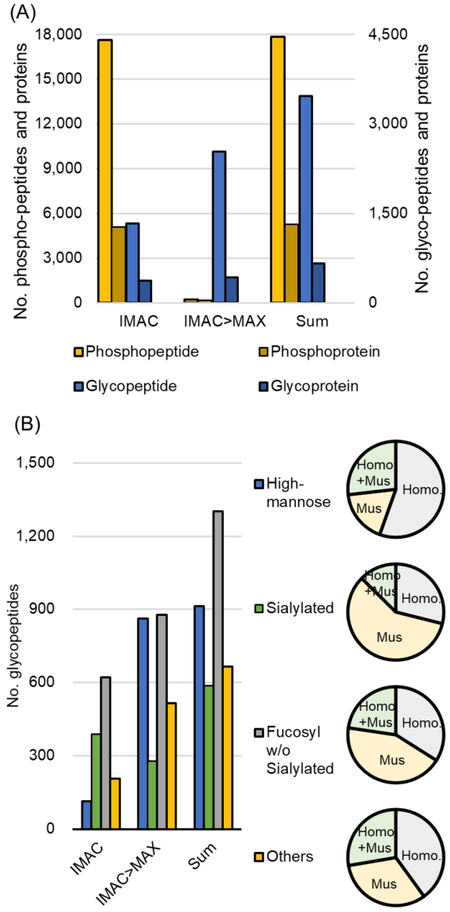
Figure 4.
Characteristics of simultaneously enriched phosphopeptides and IGPs. (A) Numbers of identified phosphopeptides (left y-axis) and IGPs (right y-axis) using workflow by IMAC followed by MAX enrichments from 13 fractions. (B) Glycan profile distribution. Pie charts show the spectral distribution according to their glycan class. “Homo+Mus” indicate indistinguishable species of the identified peptides.

