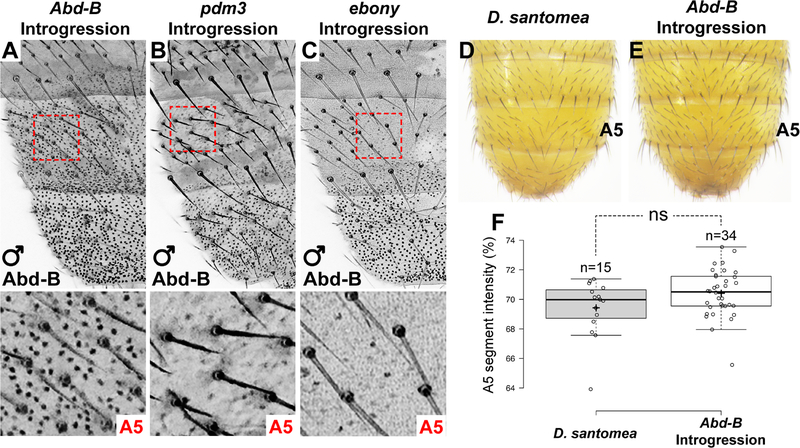
Figure 3. Epistatic interactions mask the phenotypic effects of a D. yakuba Abd-B allele in D. santomea.
(A-C) Expression patterns of Abd-B in introgression lines containing the D. yakuba Abd-B gene (A), pdm3 gene (B), or ebony gene (C) at mid-late pupal stages (~68 hAPF). Bottom panels show magnified images of the A5 regions outlined by red dashed lines. (D, E) Comparison of the Abd-B introgression phenotype (E) to wildtype D. santomea (D). (F) Quantification of A5 segment intensity of Abd-B introgression individuals compared to D. santomea (ns = not significant, Student’s t-test). See also Figure S3.

