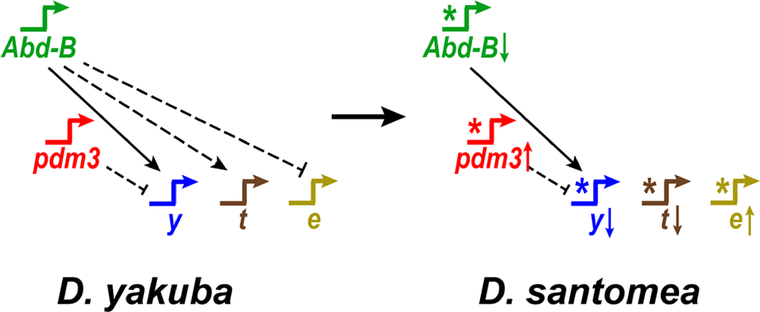
Figure 7. Genes throughout a Hox-regulated network contribute to a major shift in phenotype.
The pigmentation network of D. yakuba is compared to D. santomea. Stars represent cis-regulatory changes that altered network topology. Long arrows or bars between genes show activating or repressing interactions, respectively. A solid line indicates a direct interaction. Dashed lines represent indirect or undetermined connections. Arrows after gene names indicate up or down regulation in D. santomea.

