
FIGURE 7.
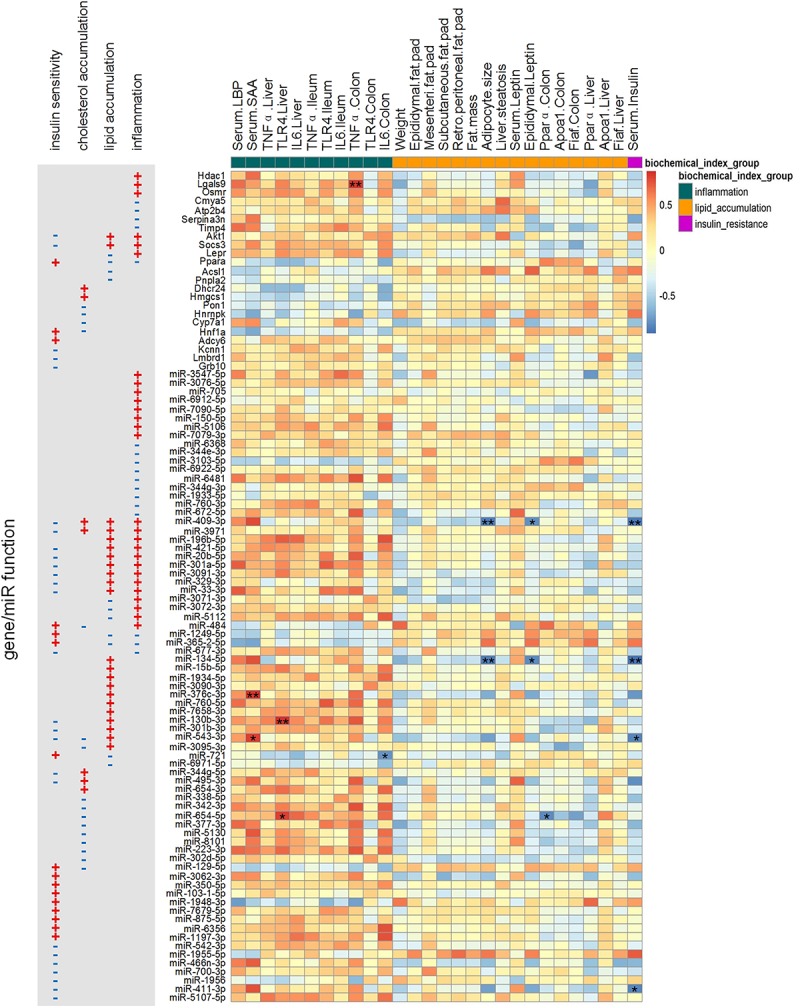
Spearman correlations between physiological/biochemical parameters and the expression levels of key miRNAs/genes. The p-value was post adjusted by the method of Benjamini and Hochberg. N = 4 or 5 for each group. ∗∗ adjusted p-value < 0.01 and * adjusted p-value < 0.05.