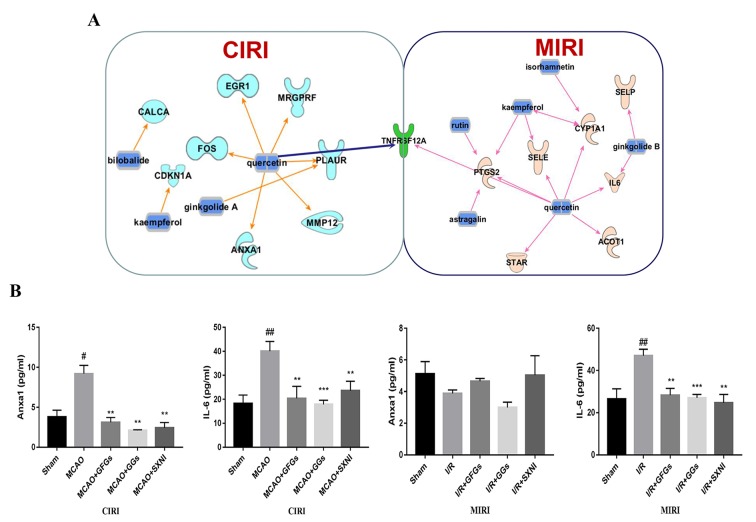
Figure 6.
GFGs and GGs regulated common and different genes in MIRI and CIRI mice. Previously identified differentially expressed genes, databases of GFGs and GGs of SXNI and their corresponding targets were used to reveal the interaction network by Ingenuity® Pathway Analysis (IPA). (A) The relationship between GFGs and GGs of SXNI (in blue) and their crucially targeted genes in CIRI (in light blue) and MIRI (in light purple), as well as the shared target gene (in green). (B) Effects of GFGs and GGs on the expression of interleukin 6 and annexin A1 in mice subjected to MIRI or CIRI (n = 3). Values were expressed as mean ± SD. # P < 0.05, ## P < 0.01 vs. sham group, **P < 0.01, vs. model group.

