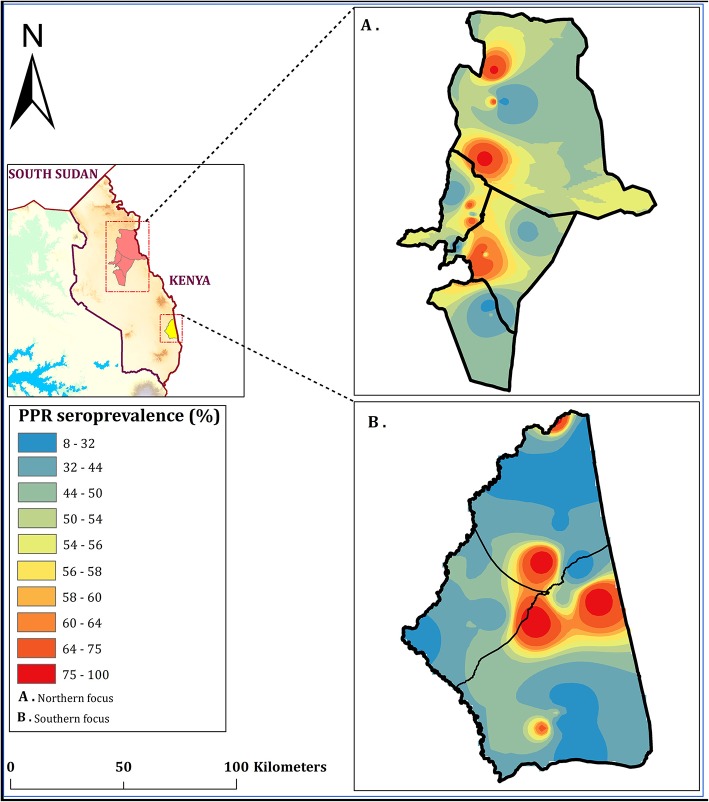
Figure 6.
Seroprevalence of PPR in Karamoja subregion (in set); May 2018. Shows the spatial distribution of PPR in the northern focus (A) and the southern focus (B) interpolated using 25 PPR point prevalence in each focus to create a focus-wide spatial effect. Interpolations were made using inverse-distance weighted (IDW) method using the Geostatistical Analyst tool in ArcMap ver. 10.5 software to produce a continuous PPR prevalence raster map on a spectral color ramp.

