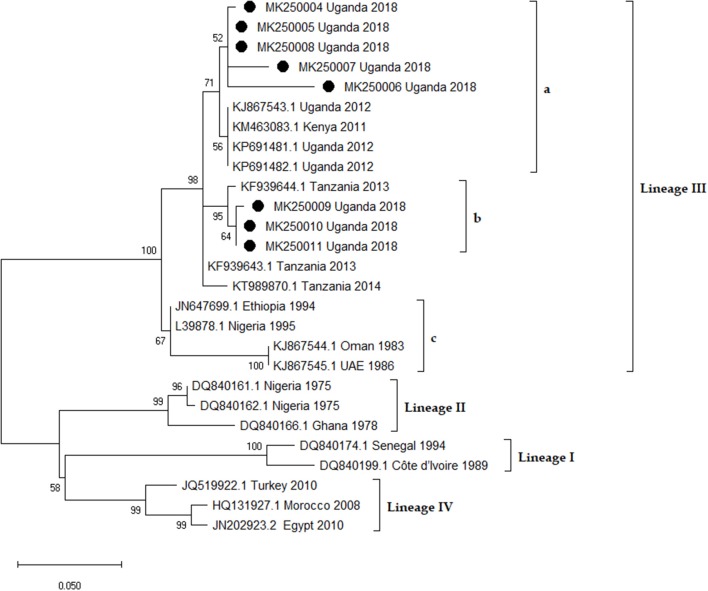
Figure 9.
Phylogenetic analysis of Peste des petits Ruminants virus Nucleoprotein (N) gene fragment in MEGA X software. The Maximum Likelihood method and the Kimura 2-parameter [+ I] models were selected to best infer evolutionary relationship. The tree is drawn to scale, and the branch lengths correspond to the number of nucleotide substitutions per site. Bootstrap values of 1,000 replicates are indicated at each node. The rate variation model allowed for some sites to be evolutionarily invariable ([+I], 30.00% sites). This analysis involved 27 nucleotide sequences and their accession numbers and countries of origin are indicated. The sequences from this study are denoted by black circles [•] and they form two sub-clusters (a and b) in lineage III. Sub-clusters a and b are from the southern and northern foci, respectively.

