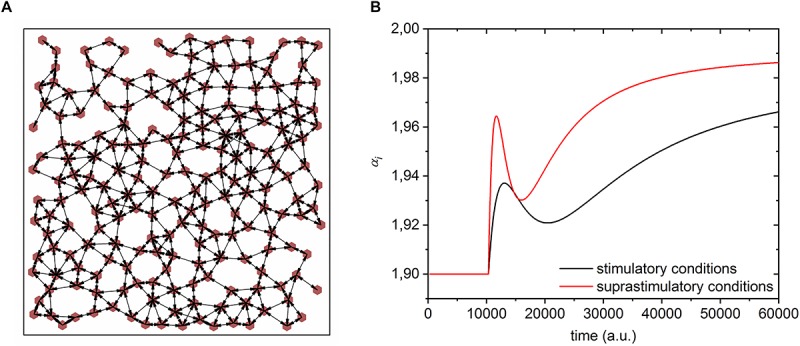
FIGURE 2.

Features of the phenomenological model of beta cell population. (A) A typical simulated beta cell network architecture. Red dots denote individual cells and the arrows depict intercellular electrical coupling. (B) Simulated time course of beta cell excitability rate after switching from substimulatory to stimulatory (Δα = 0.08, A = 0.45, B = 0.0004, , ts = 10000) and suprastimulatory (Δα = 0.09, A = 0.70, B = 0.0008, , ts = 10000) conditions.
