FIGURE 7.

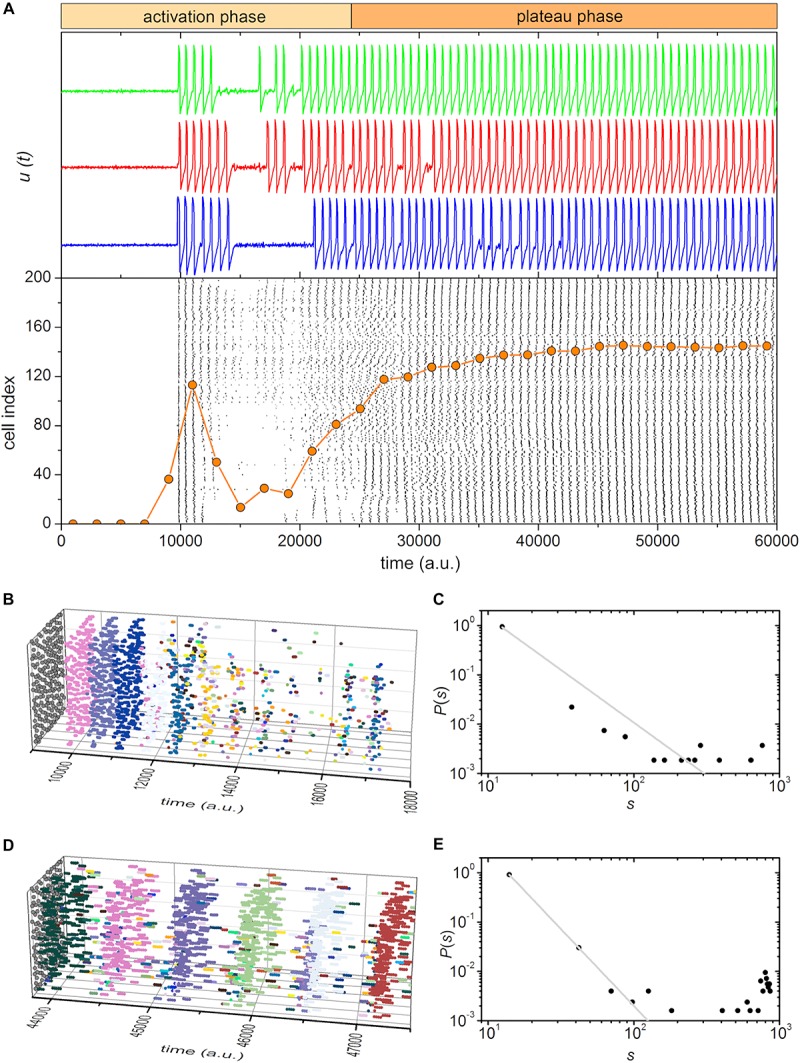
Simulated beta cell responses after switching from a substimulatory to a suprastimulatory level of stimulation, i.e., from 6 to 12 mM glucose. (A) Three characteristic traces of simulated cellular dynamics and the raster plot of binarized cellular activity. The orange dotted line indicates the fraction of active cells within the given time-window that was slid throughout the simulation. (B,D) 3D raster plots showing the excitation waves for selected intervals for the activation (B) and plateau (D) phase. Colors denote individual waves. (C,E) The distributions of excitation wave sizes for the activation (C) and plateau (E) phase. The gray dashed line indicates the power-law fit.
