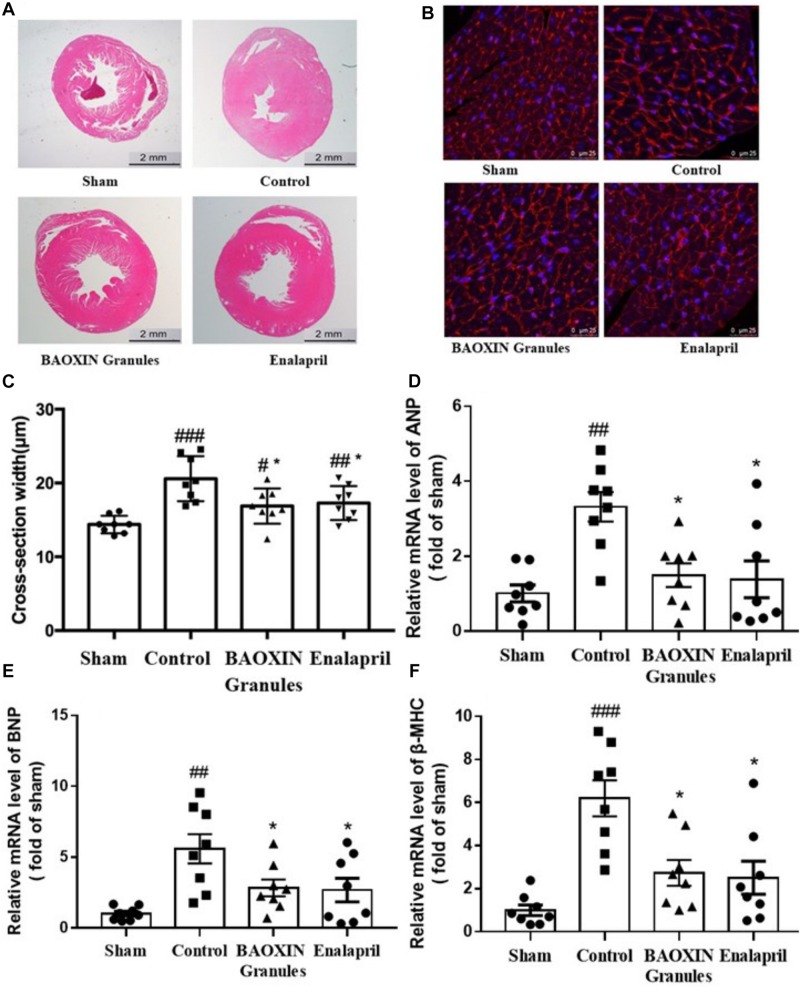
FIGURE 3.
Morphological analysis of cardiac hypertrophy and the changes of some biomarkers. Representative photographs with left ventricular tissue sections in four groups by low (A, H.E. staining) and high (B, WGA staining) magnification. The cross-section width (C) was measured with the photos in high magnification (WGA staining) by the software ImageJ. Total 50 myocardial cells/section and three sections were measured in one sample. Hypertrophy biomarkers of ANP (D), BNP (E), and β-MHC (F) in heart tissues were evaluated by their mRNA levels. The numerical data were showed as mean and standard error of the mean (mean ± SEM). p < 0.05, p < 0.01, or p < 0.001 compared with the Sham group; *p < 0.05, ∗∗p < 0.01, or ∗∗∗p < 0.001 compared with the Control group, n = 8.

