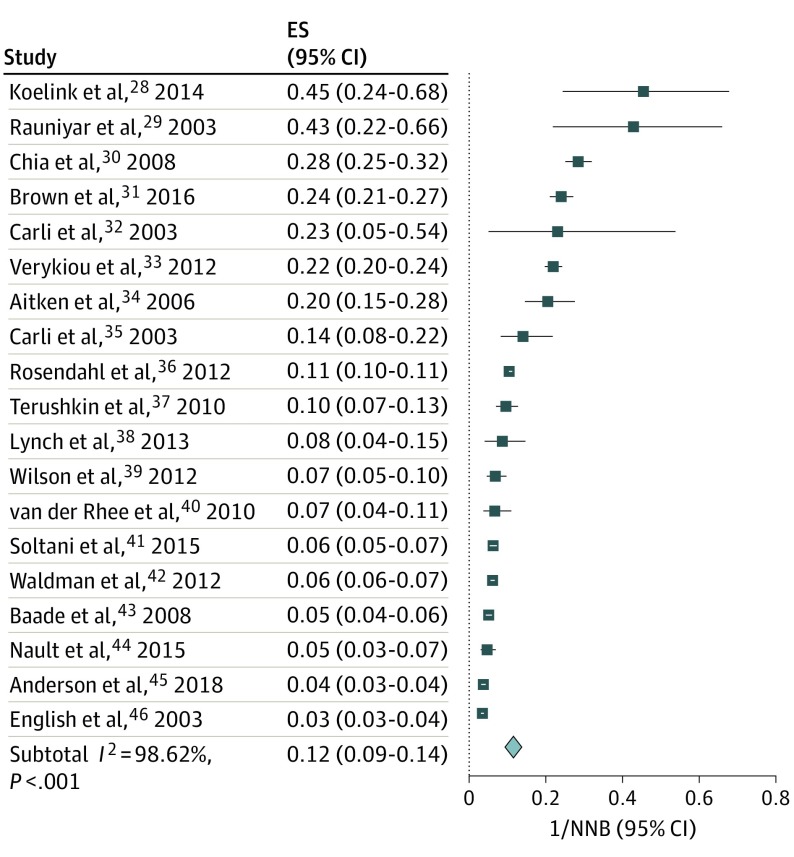
Figure 2. Proportion of Clinical Concern for Melanoma in Stratum C Studies.
Data represent the number of melanoma diagnoses as a proportion of the number needed to biopsy (1/NNB). Design stratum C demonstrates statistically significant heterogeneity (I2>98.37%); thus, combining studies within individual study design stratum should be approached with caution. The summary effect size (ES) demonstrates that a mean 12% of biopsies demonstrated melanoma for study stratum C (ES, 0.12; 95% CI, 0.09-0.14). The horizontal lines adjacent to each square indicate CIs. The diamond represents the meta-analyzed effect size for the individual study stratum.

