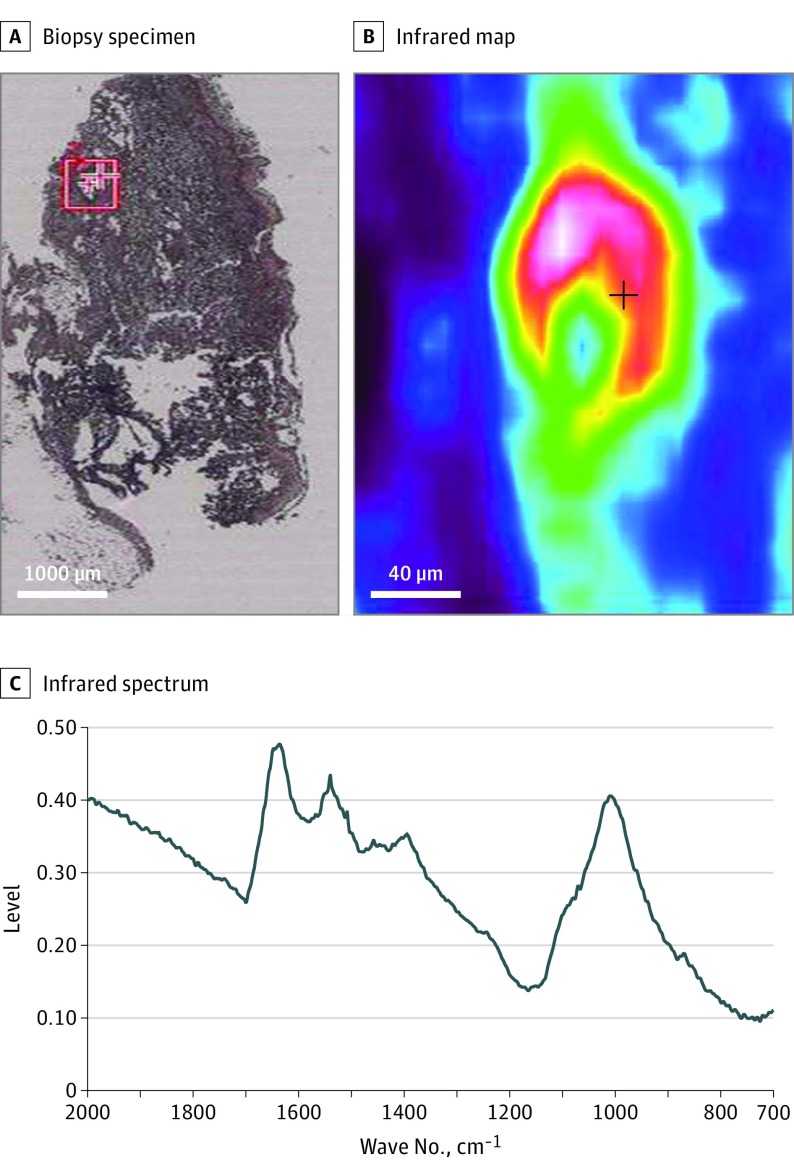
Figure 3. μ Fourier Transform Infrared (FT-IR) Spectroscopy of the Interstitial Calcific Uremic Arteriolopathy (CUA) Deposits.
A, Skin biopsy of CUA; B, Infrared map of the red square area, showing an intense vascular deposit; C, Infrared spectrum of this vascular deposit: calcium–phosphate apatite spectrum with characteristic peaks (1009, 958 and 870 cm–1) in a protein matrix (skin tissue). The same spectrum was obtained for CUA and arteriolosclerosis vascular calcifications.

