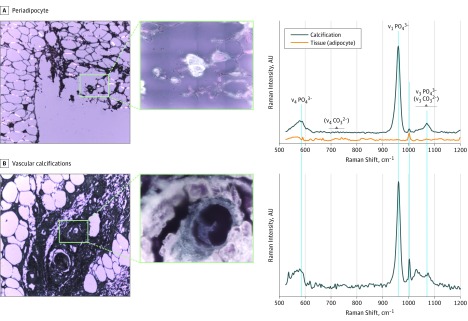
Figure 4. Micro-Raman Signatures and Optical Micrographs of Periadipocyte and Vascular Calcifications.
Micrographs (original magnifications ×10 and ×100) of (A) Periadipocyte and (B) Vascular calcifications (excitation wavelength λexc = 785 nm; numerical aperture, 0.9). The Raman bands at 960, 1076, and 590 cm–1 correspond, respectively, to the ν1, ν3 and ν4 phosphate vibrations of apatite. The low-intensity ν4 carbonate vibrations around 680 to 715 cm–1, expected for carbapatite, are not observed. The strong fluorescence background has been corrected on the presented spectra.

