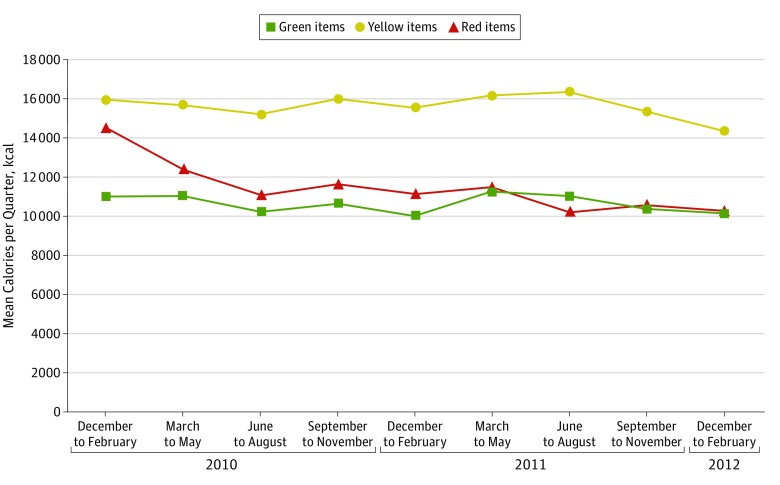
Figure 2. Mean Calories Purchased per Quarter by Employees Who Were Frequent Cafeteria Purchasers (n = 453).
Values after baseline (March 1, 2010, to February 29, 2012) are calculated using regression-adjusted differences, controlling for age, sex, race/ethnicity, job type, and full-time or part-time status as well as person random effects.

