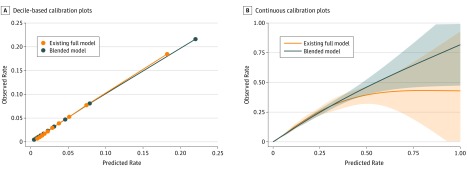
Figure. Plots for the Existing Full Model and the Blended Model.
The blended model demonstrated a closer calibration than the existing full model. A, Decile-based calibration plots are calculated from the 5-fold cross-validation showing stable model calibration. B, Continuous calibration plots with 95% CIs (shaded areas) are shown for the 2 models.

