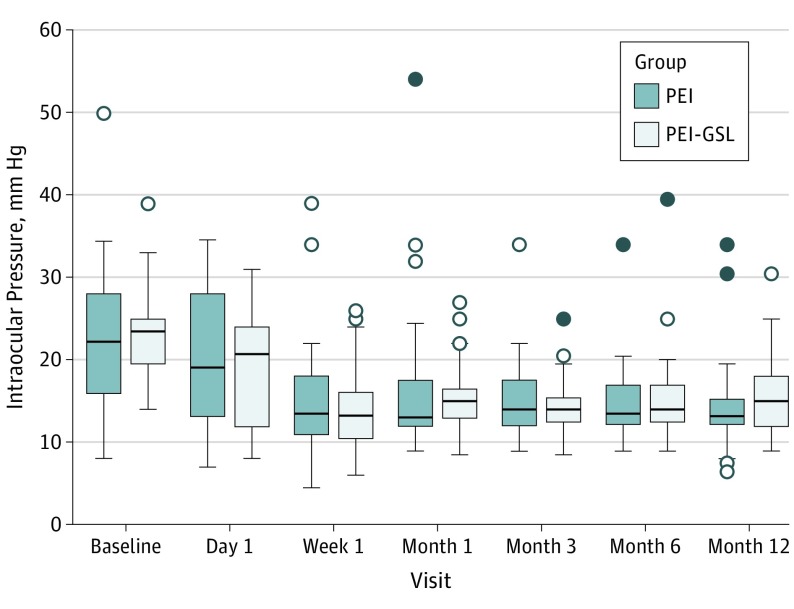
Figure 2. Box Plots for Intraocular Pressure Measurements Over the 12 Months, Periods Based on the Intent-to-Treat Analysis.
The horizontal line in the middle of each box indicates the median. The top and bottom borders of the box mark the 75th and 25th percentiles, respectively. The whiskers above and below the box mark the 90th and 10th percentiles. The points beyond the whiskers are outliers beyond the 90th or 10th percentiles. PEI indicates phacoemulsification; PEI-GSL, PEI with goniosynechialysis.

