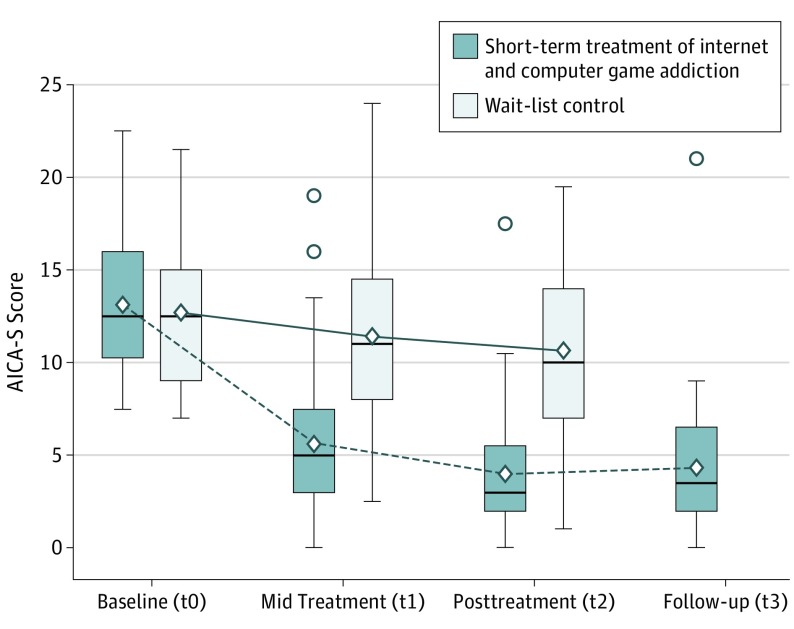
Figure 2. Changes of the Mean Subjective Assessment of Internet and Computer Game Addiction (AICA-S) Scores Across Measurement Points.
Comparison of short-term treatment for internet and computer game addiction group with wait-list control group. The horizontal line in the middle of each box indicates the median. The diamond within each box indicates the mean. Top and bottom borders of the box mark the 75th and 25th percentiles, respectively. The whiskers above and below the box mark the 90th and 10th percentiles. The circles beyond the whiskers are outliers. t0 indicates time factor, baseline; t1, time factor, midtreatment; t2, time factor, termination; and t3, time factor, 6-month follow-up.

