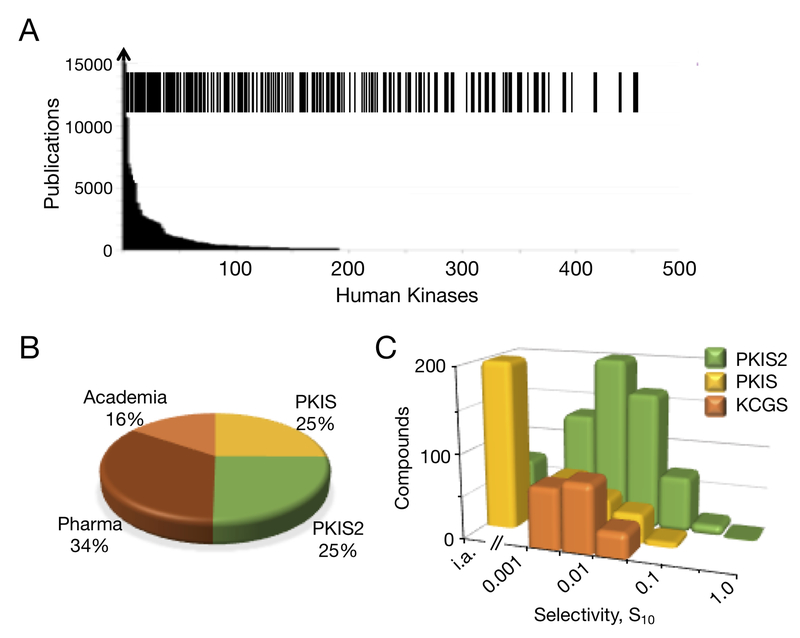
Figure 3.
The Kinase Chemogenomic Set, KCGS. A) Coverage of human kinases by KCGS. Each line in the barcode indicates a kinase that has at least one potent inhibitor in the set. Shown in the background is the number of publications on each kinase as reported by Knapp et al.2 B) Origin of the kinase inhibitors in KCGS. Half of the set was selected from PKIS and PKIS2. An additional third of the set was sourced from multiple pharmaceutical companies. The remaining inhibitors originated from academic laboratories. C) Comparison of the range of kinase selectivities of the inhibitors in PKIS, PKIS2, and KCGS. Compounds were binned by their calculated kinase selectivity index (S10 at 1 μM) from data collected in the Nanosyn, KINOMEscan,or other large kinase panels. KCGS contains only narrow spectrum inhibitors with a selectivity index S10 < 0.05. PKIS2 contains many promiscuous inhibitors with S10 > 0.05. i.a. indicates no kinases inhibited by 90% at 1 μM. PKIS contains many inhibitors with < 90% inhibition of kinase activity at 1 μM.

