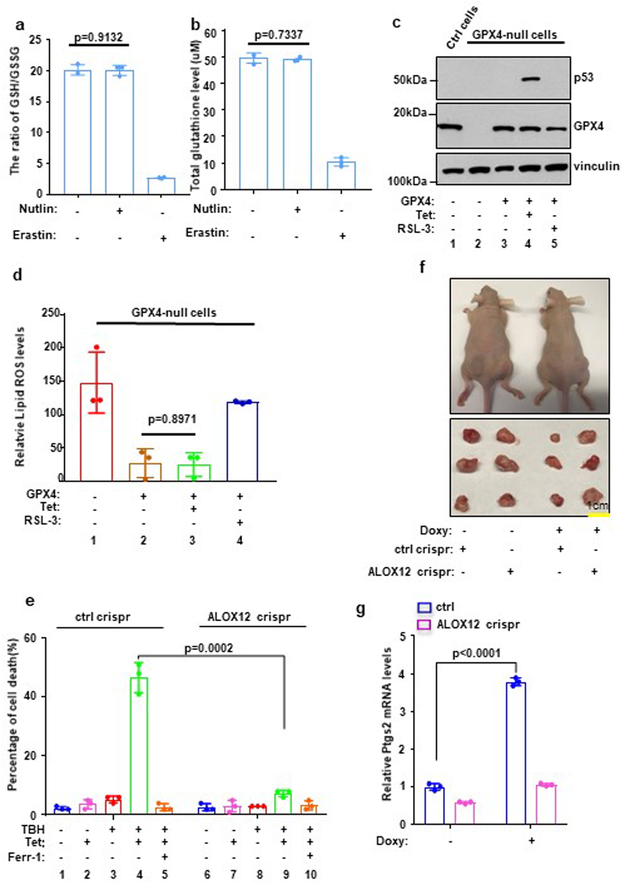
Figure 2. ALOX12 is critical for p53-mediated tumor growth suppression.
a) The ratio of reductive GSH to oxidative GSH was measured by GSH/GSSG quantification kit in U2OS cells with or without Nutlin (10uM) or Erastin (10uM) treatment. Error bars are mean ± s.d., n=3 independent experiments.
b) Total glutathione levels were measured by GSSG/GSH quantification kit in U2OS cells with or without Nutlin (10uM) or Erastin (10uM) treatment.
c) Western blot analysis of H1299 Tet-on p533KR GPX4 crispr cells transfected with GPX4 expression vectors. The experiments were repeated twice, independently, with similar results.
d) Quantification of lipid peroxidation levels from Fig. S2d is shown in H1299 Tet-on p533KR control or ALOX12 crispr clones pre-incubated with doxycycline (0.5μg/ml) were treated with doxycycline (0.5μg/ml), and RSL-3 (1uM) as indicated for 8h. Error bars are mean ± s.d., n=3 independent experiments.
e) H1299 Tet-on p533KR control or ALOX12 crispr clones pre-incubated with doxycycline (0.5ug/ml) were treated with doxycycline (0.5ug/ml) and TBH (60uM) as indicated for 8h. Error bars are mean ± s.d., n=3 independent experiments.
f) Xenograft tumors from H1299 Tet-on p533KR control and ALOX12 crispr cells fed with regular or doxycycline-containing chow (625mg kg−1) as indicated (see methods). The experiments were repeated twice, independently, with similar results.
g) Q-PCR of PTGS2 from tumors harvested in f; Error bars are mean ± s.d., n=3 independent experiments. All P values (a,d,e,g) were calculated using two-tailed unpaired Student’s t-test. Detailed statistical tests are described in the Methods. Scanned images of unprocessed blots are shown in Supplementary Fig. 9. Raw data are provided in Supplementary Table 1.

