
Extended Data Fig. 6. Small number of human α-cell pseudoislets is sufficient to ameliorate diabetes in mice.
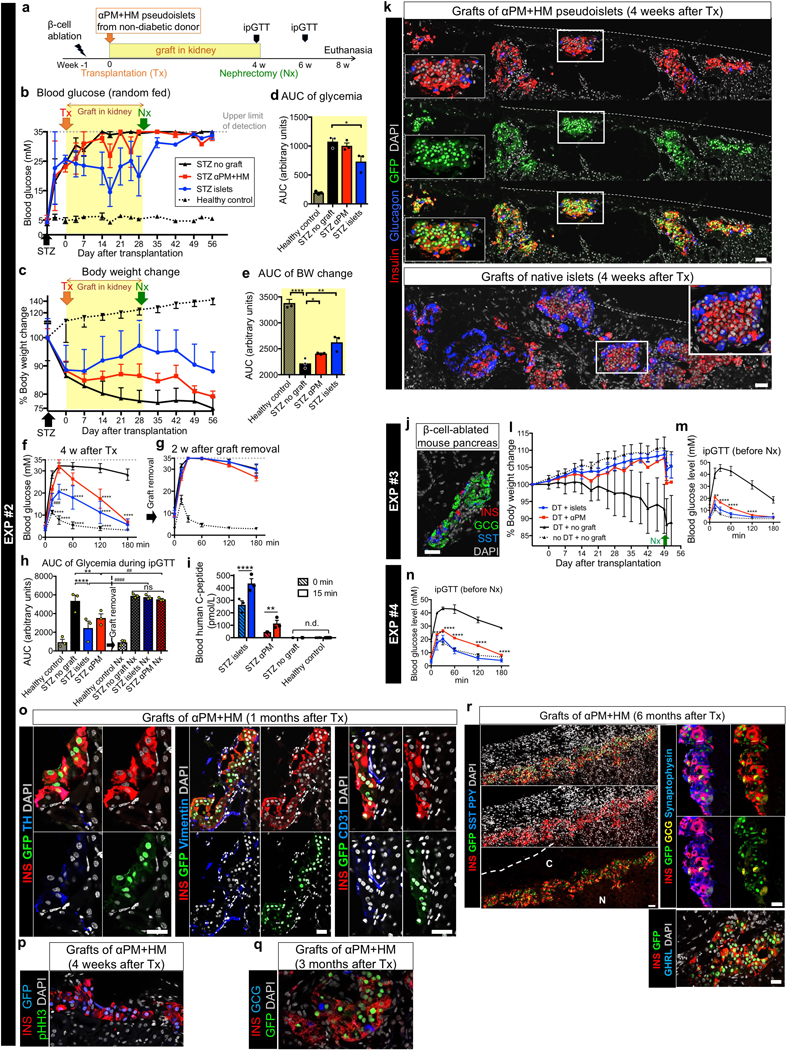
(a) Experimental time-line of Exp. #2. NSG mice were made diabetic with STZ and a week later were transplanted with 200–1000 αPM+HM pseudoislets (“STZ αPM+HM”) obtained from 3 donors (n = 3). As controls, STZ-diabetic mice were implanted with either no graft (“STZ no graft”) or the same number of native human islets (“STZ islets”). Non-diabetic NSG control mice were also monitored. Nephrectomy (“Nx”) was performed 4 weeks after transplantation for graft removal. For details, see Supplementary Table 5. (b) Random-fed blood glucose throughout Exp. #2. There is no significant improvement of hyperglycemia in STZ αPM mice (see Extended Data Fig. 6a for the areas under the curves of the engraftment period). n = 3 mice grafted with 3 different donors in all groups. (c) Body weight changes after STZ injection. There is body weight gain after transplantation with intact islets or αPM pseudoislets, and continuous weight loss in untransplanted diabetic controls (see Extended Data Fig. 6b for the areas under the curves of the engraftment period). Graft removal breaks this trend. n = 3 mice grafted with 3 different donors in all groups. (d) The “area under the curve” of random-fed blood glucose measurements during the engraftment period (indicated in yellow in b) show significant hyperglycemia improvement (lowering) only in mice engrafted with native islets. *p = 0.022, one-way RM ANOVA with Holm-Sidak’s multiple comparisons test. n = 3 different donors. (e) The area under the curve of body weight changes during engraftment (indicated in yellow in c) show significant body weight gain after transplantation with intact islets (“STZ islets” group) and αPM+HM pseudoislets (“STZ αPM” group). ****p < 0.0001, **p = 0.003, *p = 0.042, one-way RM ANOVA with Holm-Sidak’s multiple comparisons test. n = 3 different donors. (f, g) Glucose tolerance test at 4 weeks after transplantation (f) and after graft removal (g). Engrafted mice display recovery after 3 hours (f), yet this capacity is lost upon graft removal (g). Analysis of the area under the curve in f and g are shown in Extended Data Fig. 6h. ****p < 0.0001, ***p = 0.0007, ###p = 0.0009, versus STZ no graft, two-way RM ANOVA with Dunnett’s multiple comparisons test. n = 3 mice grafted from different donors (STZ αPM, STZ islets), n = 7 mice (STZ no graft), n = 6 mice (no STZ no graft). (h) Area under the curve of ipGTT at 4 weeks after transplantation (see also f) and 2 weeks after graft removal (see also g). There is partial STZ-diabetes recovery in “STZ αPM” mice, but not in “STZ no graft” group (left in h). After graft removal, both “STZ islets” and “STZ αPM“ groups become hyperglycemic again (right in h), proving that improvement in glucose tolerance and weight gain is graft-dependent. ****p = 0.00007, **p = 0.0025, ####p = 0.00002, ##p = 0.0014, one-way ANOVA with Benjamini, Krieger and Yekutieli’s multiple comparisons test. n = 3 mice grafted from different donors (STZ αPM, STZ islets), n = 7 mice (STZ no graft), n = 6 mice (no STZ no graft). (i) Blood human C-peptide levels in mice measured before (“0 min”) and after (“15 min”) glucose injection. Glucose-responsive C-peptide release is observed in mice bearing human islets or αPM pseudoislets. n.d., undetectable. **p = 0.0015, ****p = 5 × 10⁻⁸, two-way RM ANOVA with Holm-Sidak’s multiple comparisons test. n = 3 mice grafted from different donors (STZ αPM, STZ islets), n = 7 mice (STZ no graft), n = 6 mice (no STZ no graft). (j) Immunofluorescence of pancreas in the NSG RIP-DTR mouse that was transplanted with αPM pseudoislets (Exp.#3: DT+αPM, Figure 3b) shows that endogenous mouse β-cells were well-ablated and did not regenerated, suggesting improvement of diabetic symptoms was dependent on human αPM graft. Images are representative from 9 different diabetic mice after DT injection. (k) Immunofluorescence of pseudoislet kidney grafts in “STZ αPM” (upper panels) and “STZ islets” mice (lower panels), 4 weeks after transplantation. Monohormonal insulin-producing cells with GFP-tracer are abundant in the engrafted αPM+HM pseudoislets. Images are representative from n =4 mice with different donors’ grafts. (l) Body weight changes in experimental animals of Figure 3b (Exp. #3). After DT injection, untransplanted diabetic controls (DT + no Graft) exhibited continuous weight loss, while there is body weight gain after transplantation with intact islets or αPM pseudoislets. Nx: nephrectomy for graft removal. Error bars: SD. (m,n) Intraperitoneal glucose tolerance test (ipGTT) at 7 weeks after transplantation (related to Fig. 3b-d), shows significantly improved glucose tolerance both in DT+αPM and DT+islets groups. ****p < 0.0001, **p = 0.002, *p = 0.0338, versus DT + no graft, two-way RM ANOVA with Dunnett’s multiple comparisons test. Groups are indicated by same colored lines as Fig. 3b,c. n = 3 for DT + islets, n = 1 for DT + αPM, n = 5 for DT + no graft, and n = 5 for no DT + no graft (l,m). n = 2 for DT + islets, n = 1 for DT + αPM, n = 3 for DT + no graft, and n = 4 for no DT + no graft (n) (o) αPM pseudoislets grafted into mouse kidney show innervation (TH+) and vascularization (CD31+) 1 month after transplantation. (p) Proliferation marker pHH3 staining on grafts of αPM+HM 4 weeks after transplantation, showing almost no proliferative cells in grafts (< 1%). (q,r) Immunofluorescence of grafted αPM pseudoislets shows reprogrammed α-cells express insulin as well as GFP tracer at 3 moths after transplantation (q) and 6 months after transplantation (r), confirming a stable phenotype of αPM cells under in vivo environment. Left panels in r are confocal tile-scan images which were merged as a maximum projection. We did not detect any SST, PPY or GHRL positive cells. Black-line: non-grafted diabetic mice; red-line: diabetic mice with αPM+HM graft; blue-line: diabetic mice with native islet graft; black-dotted-line: healthy mice in b-I, l-n. All data shown are means ± s.e.m. (except in l; bars are SD). Scale bars: 50 μm. All images are representative from 9 different diabetic mice after DT injection (j), from n =4 (k), n=3 (o,p), n=1 (q), or n=1 (r) donors.