
Extended Data Fig. 8. Transcriptomic analyses.
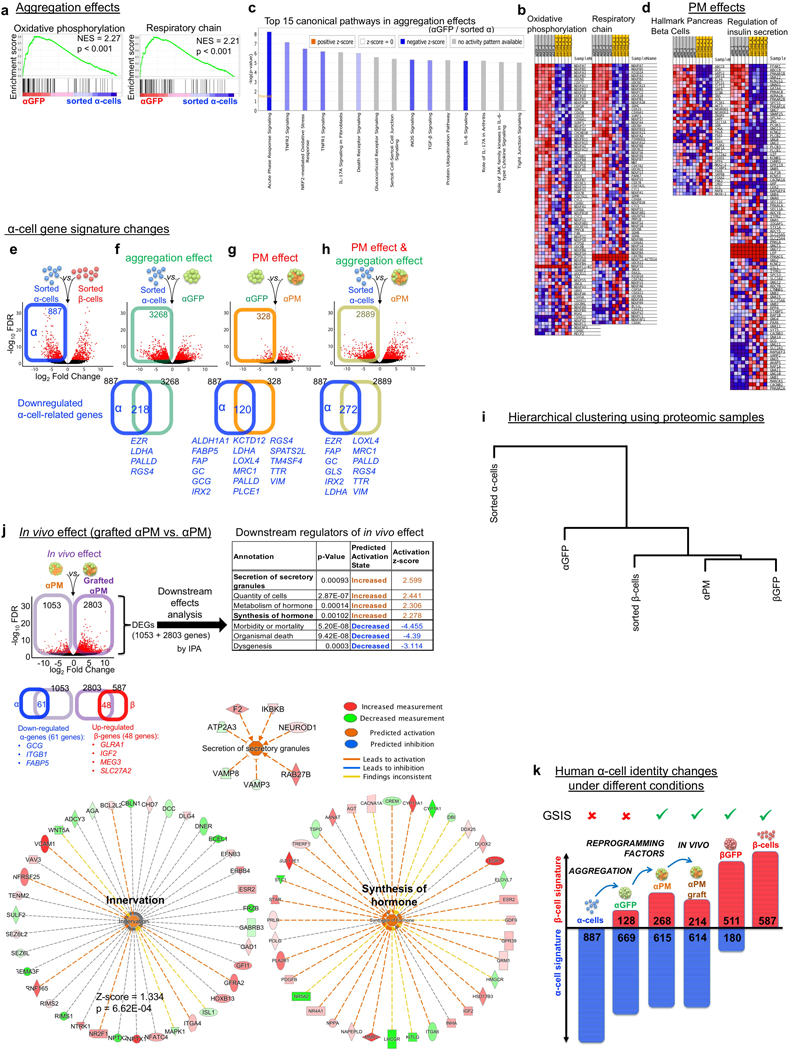
(a,b) Gene-set enrichment analysis (GSEA) using the transcriptomes of sorted α-cells and αGFP pseudoislets. There is a significant enriched expression of genes associated with β-cell function such as mitochondrial “oxidative phosphorylation” and “respiratory chain” in αGFP pseudoislets compared to sorted α-cells (a). Heatmaps of transcriptomic expression levels of listed genes tested in GSEA (b). Gene sets were taken from GO gene sets of Molecular Signatures Database v6.0. (c) Top 15 Canonical pathways that differ between sorted single α-cells and αGFP pseudoislets. Inflammatory/stress-related pathways were downregulated in αGFP pseudoislets compared to sorted α-cell singlets. Pathway analyses were done by IPA. (d) Heatmaps of transcriptomic expression levels of gene sets in αPM pseudoislets and sorted α-cells (related to GSEA in Figure 4g). (e) Volcano plot representing differentially-expressed genes (DEGs) in sorted α-cells and β-cells (FDR < 0.05, FC > 2). 887 α-cell-enriched genes were identified. The blue box delimitates α-cell-enriched genes, i.e. the “α-cell signature” (Supplementary Table 14). (f-h) Changes in expression of ‘α-cell signature’ genes caused by reaggregation and PM effects. Volcano plots showing DEGs in αGFP pseudoislets relative to sorted α-cells (f) that characterize the cell reaggregation effect, in αPM pseudoislets relative to αGFP pseudoislets (g), reflecting the effect of Pdx1 and MafA expression, and in αPM pseudoislets relative to sorted α-cells (h), which reflects the combined effect of cell reaggregation and transcription factor expression. Downregulated DEGs in each condition (colored squares on volcano plots of f-h) were overlapped with the α-cell-enriched gene list of e, as a measure of repressed α-cell signature. The Venn diagrams show that 218 α-enriched genes are downregulated in α-cells upon aggregation (f, Supplementary Table 15), 120 genes upon Pdx1 and MafA activation (g, Supplementary Table 16), and in total 272 “α-like genes” are downregulated in α-cells as a result of the combined effect of cell aggregation and transcription factor expression (h, Supplementary Table 17). DEGs: FDR < 0.05. (i) In vivo effect on αPM cells at 1 month after transplantation. DEGs (FDR < 0.05) between αPM pseudoislets before transplantation (n = 7) and in grafted αPM pseudoislets (n = 5) were analysed with IPA to identify downstream effects. Several pathways were activated, including “synthesis of hormone”, “secretion of secretory granules” and “innervation”. See details in Supplementary Table 20. n = 5 grafts from 9 non-diabetic donors were retrieved from the mouse renal capsules, FACS-sorted with GFP, and analyzed by bulk RNA-Seq. (j) Effect of cell aggregation and reprogramming factor expression on human α-cell identity. Reaggregation of dispersed α-cells and expression of the transcription factors Pdx1 and MafA (PM) promotes the upregulation of a subset of β-cell-enriched genes (“β-cell signature”), which is sufficient to confer a glucose-stimulated insulin secretion activity (GSIS) to α-cells in monotypic αPM pseudoislets. Concomitantly, some but not all the α-cell-enriched genes (“α-cell signature”) are downregulated in αPM pseudoislets, leading to a hybrid “α/β” signature. Figures and histograms represent the number of genes affected. (k) Hierarchical clustering analysis in proteomic in vitro samples showing protein signatures of αPM pseudoislets are closer to β-cells.