
Extended Data Fig. 2. Reaggregation of dispersed purified human β-cells.
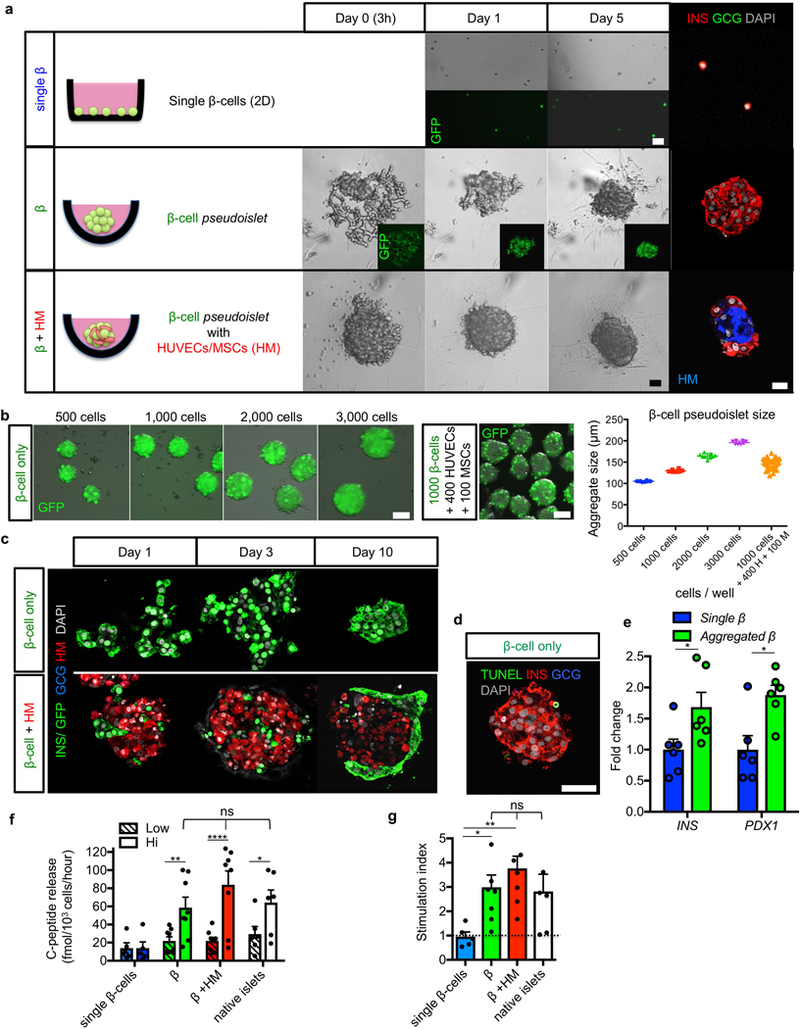
(a) Pure β-cells were labeled with GFP and traced in 3 different culture conditions: in monolayer (“single β”), β-cell-only aggregation (“β”), or β-cell aggregation with stromal cells including HUVECs and MSCs (“β+HM”). Live imaging at indicated days (middle panels) and immunofluorescence at day 7 (right panels) show β-cell-only pseudoislets were self-organized by Day 5, whereas β+HM aggregates were constituted in only 1 day. β-cells in β+HM pseudoislets located at the periphery, while HM cells formed the core of the aggregates (red and blue, respectively). (b) To determine the optimal number of β-cells per pseudoislet, GFP+ transduced β-cells were seeded on aggregation-plate-wells at the indicated densities. 7 days after culture, aggregates were harvested and analyzed. Aggregates were uniform in size. Pseudoislet size correlated with the number of cells seeded per well. It was reported that human islet cell aggregates with a diameter 100—150 μm, consisting of 1000 cells, show a comparable function to native islets 24; we thus decided to perform reaggregation experiments at 1000 β-cells/pseudoislet (1000 β-cells, 129.6±3.1 μm). β-cell aggregates with HM were also analyzed. n = 8 pseudoislets for 500 β-cells, n = 8 pseudoislets for 1000 β-cells, n = 9 pseudoislets for 2000 β-cells, n = 8 pseudoislets for 3000 β-cells, and n = 52 pseudoislets for 1000 β-cells + 400 HUVECs + 100 MSCs. (c) Immunofluorescence at indicated time-points in β-cell pseudoislets and β-cell+HM pseudoislets. (d) TUNEL staining (green) showed rare apoptotic cells (0.8%) in β-cell aggregates after 7 day-culture. (e) qPCR analyses of INSULIN and PDX1 expression in monolayer and aggregated β-cells showing higher expression of β-cell markers in reaggregated β-cells. Data are expressed as fold-change relative to the value in single β-cells. *p = 0.022 in qPCR for INS, * p = 0.026 in qPCR for PDX1, Mann-Whitney test, two-tailed. n = 6 donor samples. (f) ELISA measurements of static glucose-stimulated human insulin release at 3 mM (Low) and 20 mM (Hi) glucose showing glucose-responsive C-peptide secretion in both β and β+HM aggregates, but not in single β-cells. ****p < 0.0001, **p = 0.0037, * p = 0.012, two-way RM ANOVA with Holm-Sidak’s multiple comparisons test, n = 5 for single β-cells, n =8 for β and β+HM, n = 6 for native islets (all are biological replications from different donors). (g) Stimulation index in glucose-stimulated insulin secretion in (f) exhibiting comparable values among pseudoislets of β and β+HM and native islets. **p = 0.0089, *p = 0.045, one-way ANOVA with Benjamini, Krieger and Yekutieli’s multiple comparisons test. All images are representative from 5 (a,c,d) or 3 (b) independent experiments. ns: no statistical significance. All data shown are means ± s.e.m. Scale bars: 25 μm (a), 50 μm (c,d), 100 μm (b).