
Extended Data Fig. 3. Assessment of the effect of transcription factor expression on insulin production in human α-cells.
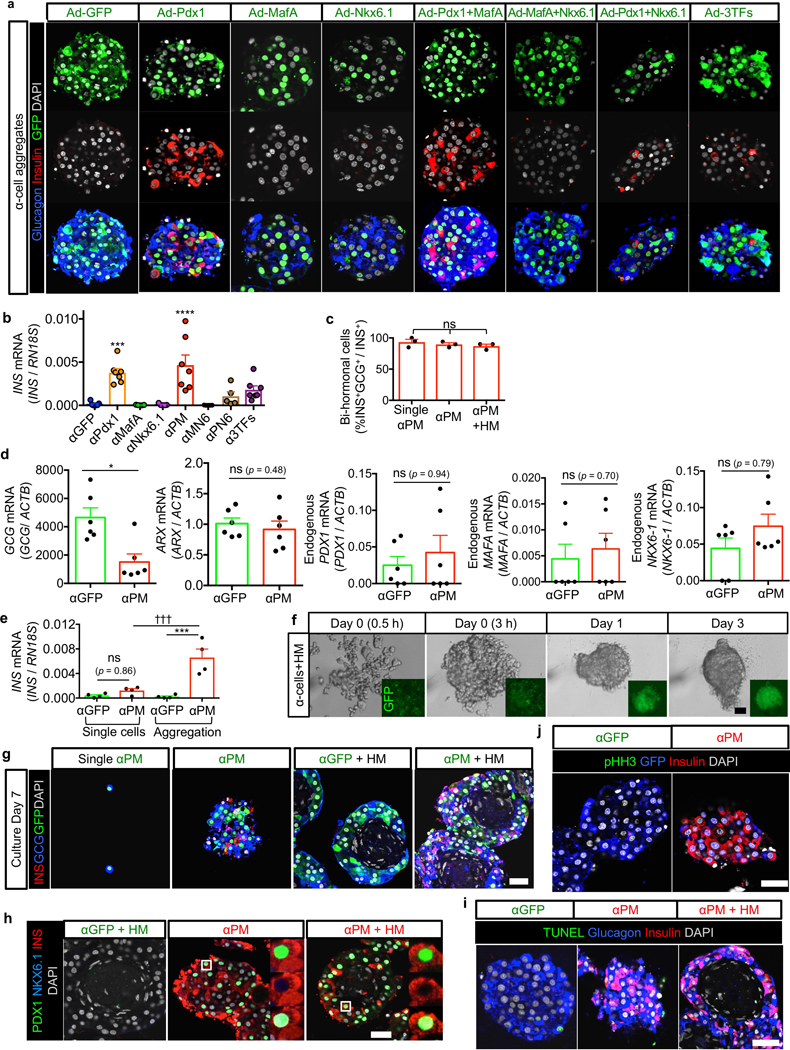
(a) Representative immunofluorescence images at 7 days of reaggregation. To determine the best α-to-β-cell reprogramming factors, human α-cells were transduced with adenoviral vectors, including Pdx1, MafA and Nkx6.1, in all combinations, and then reaggregated. Images are representative from n = 38 donors for αGFP and αPM, n = 5 for αPdx1 and α3TFs, n = 3 for αMafA, αNkx6.1, αMN6 and αPN6. (b) qPCR analysis of human insulin expression in α-cells transduced with indicated reprogramming factors, 7 days after aggregation. PM: Pdx1+MafA, MN6: MafA+Nkx6.1, PN6: Pdx1+Nkx6.1, 3TFs: Pdx1+MafA+Nkx6.1. ****p < 0.0001, ***p = 0.0006 versus αGFP control, one-way ANOVA with Tukey’s multiple comparisons test. n = 7 for αGFP, αPdx1, αPM and α3TFs, n = 5 for αMafA, αNkx6.1, αMN6, αPN6: all are biological replications from different donors. (c) Percentages of bihormonal cells (expressing insulin and glucagon) in αPM single cells, αPM-only pseudoislets and αPM+HM pseudoislets. One-way ANOVA with Tukey’s multiple comparisons, n = 3 from different donors. (d) qPCR analyses in αGFP and αPM pseudoislets cultured for 7 days. αPM cells have less glucagon expression than αGFP pseudoislets, but ARX expression is still maintained. *p = 0.015, Mann-Whitney test, two-tailed, n = 6 from different donors per group. (e) qPCR analysis for insulin expression in αGFP and αPM cells cultured in monolayer or pseudoislets. αPM single cells have less insulin expression than αPM pseudoislets; αGFP controls display only background levels. ***p = 0.0002, †††p = 0.0009, one-way ANOVA with Tukey’s multiple comparisons test, n = 4 from different donors. (f) Live-imaging of in vitro pseudoislet formation using αPM and HM cells. Aggregation is faster with HM cells. (g) Single α-cells transduced with PM show very rare reprogramming events (i.e. insulin production), whilst re-aggregated α-cells display high reprogramming efficiency. α-cells (GFP+, green) locate at the periphery of pseudoislets containing also HM cells (HUVECs/MSCs: only DAPI+, white). (h) Immunofluorescence for PDX1, NKX6–1 and insulin on αGFP, αPM and αPM+HM pseudoislets after 7 days of culture. Reprogrammed α-cells express insulin (red) and PDX1 (green), but not NKX6–1 (blue) in αPM and αPM+HM aggregates. (i) TUNEL staining (green) reveal almost no apoptosis in α-cell pseudoislets in 7-day cultures (1.8% in αGFP, 1.4% in αPM, 1.6% in αPM+HM). (j) Proliferation marker pHH3 staining (green) reveal almost no proliferation (< 1%) both in αGFP and αPM pseudoislets after 7-day cultures. Images are representative from 3 different donors (f-i). ns: no significance. All data shown are means ± s.e.m. Scale bars: 25 μm.