
FIGURE 1.
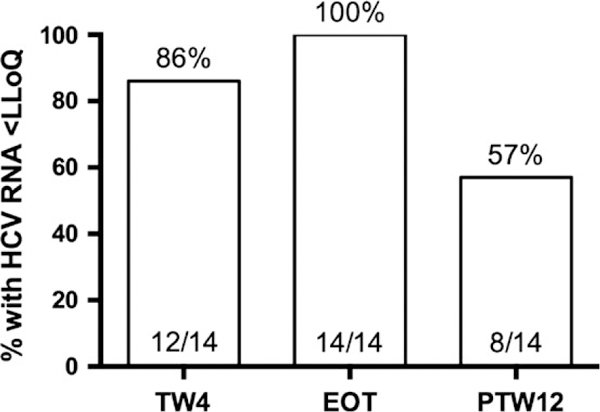
On-treatment and post-treatment virologie response. All virologie failures were relapses. HCV, hepatitis C virus; LLoQ, lower limit of quantification; TW4, treatment week 4; EOT, end of therapy; PTW12, post-treatment week 12
Official websites use .gov
A
.gov website belongs to an official
government organization in the United States.
Secure .gov websites use HTTPS
A lock (
) or https:// means you've safely
connected to the .gov website. Share sensitive
information only on official, secure websites.
On-treatment and post-treatment virologie response. All virologie failures were relapses. HCV, hepatitis C virus; LLoQ, lower limit of quantification; TW4, treatment week 4; EOT, end of therapy; PTW12, post-treatment week 12