
FIGURE 2.
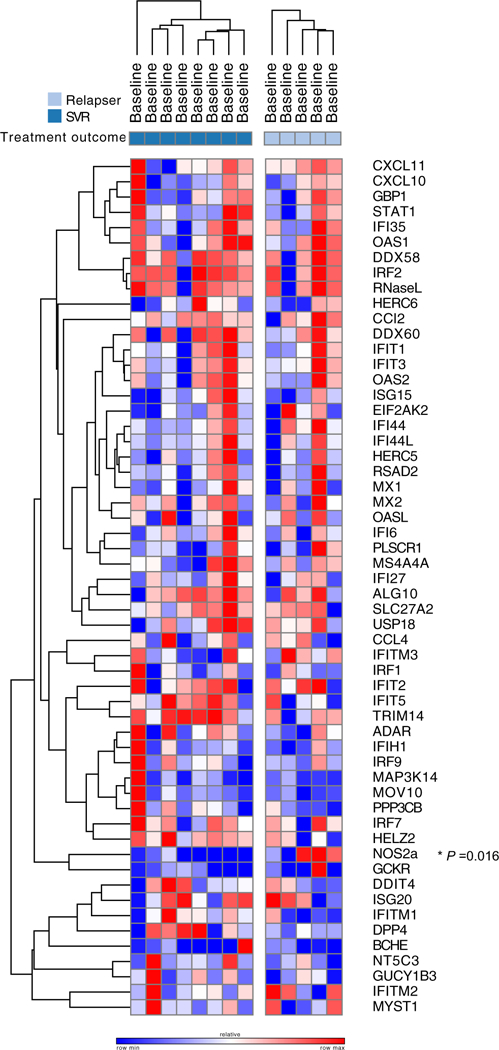
Heat map demonstrating baseline interferon-stimulated gene (ISG)/interferon-effector gene (IEG) log2-normalized gene expression among responders (SVR, dark blue) and relapsers (light blue). Red on the heat map represents upregulation and blue represents downregulation