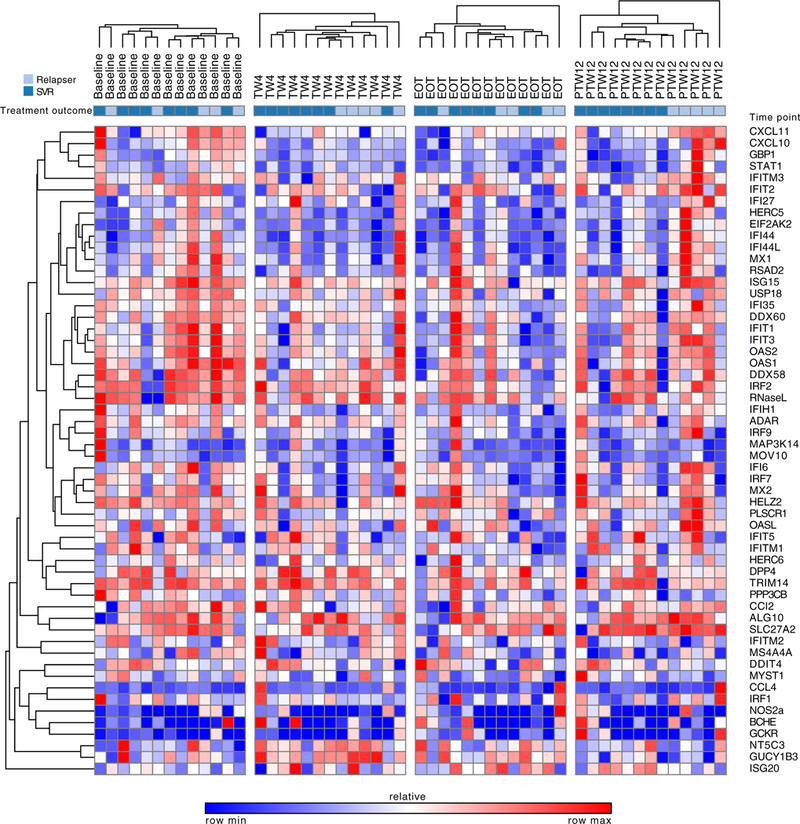
FIGURE 3.

Heat map demonstrating changes in interferon-stimulated gene (ISG)/interferon-effector gene (IEG) log2-normalized gene expression during sofosbuvir plus ribavirin therapy. Red on the heat map represents upregulation and blue represents downregulation
Note: SVR = sustained virologic response
TW4 = treatment week 4
EOT = end of treatment
PTW12 = post-treatment week 12
