
Figure 2. Clinical isolates containing EFG1 polymorphisms form the ‘intermediate’ cell state.
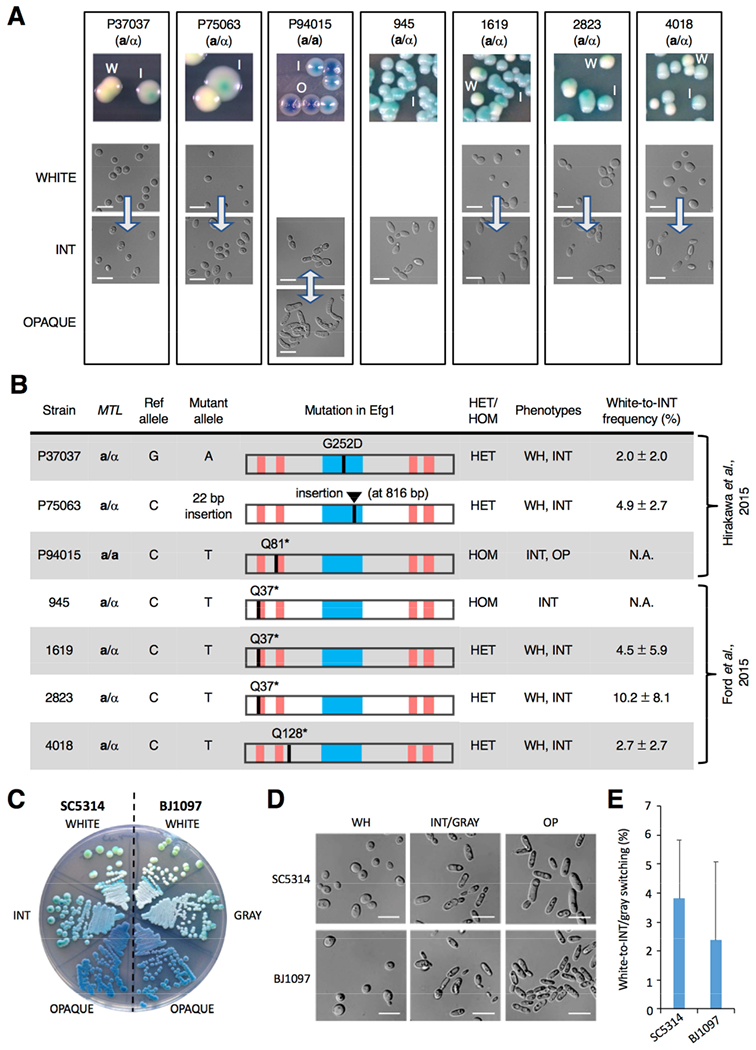
(A) Images of colony and cell phenotypes on CHROMagar (W, white; I, intermediate (INT); O, opaque) at 22°C. Scale bar, 10 μm. Arrows indicate transitions between states.
(B) Analysis of 63 clinical isolates revealed that 7 contained disruptive polymorphisms in EFG1. The APSES DNA-binding domain (blue box) and polyglutamine repeats (red bars) are shown. EFG1 mutations were heterozygous (HET) or homozygous (HOM), and cell states observed were white (WH), intermediate (INT) and opaque (OP). White-to-INT transition frequency was determined on YPD medium (22°C for 7 days) with three independent assays.
(C) White/INT/opaque phenotypes in SC5314 (EFG1+/− parental strain) v. white/gray/opaque phenotypes in BJ1097. Cells were grown on CHROMagar at 22°C for 3 days.
(D) White/INT/opaque phenotypes in SC5314 (EFG1+/− parental strain) v. white/gray/opaque phenotypes in BJ1097. Cells grown on YPD at 22°C for 3 days.
(E) Comparison of white-to-INT and white-to-gray transition frequencies in SC5314 and BJ1097, respectively, on YPD after 7 days at 22°C. Error bars, ± SD. Three independent assays performed.
See also Figure S2.