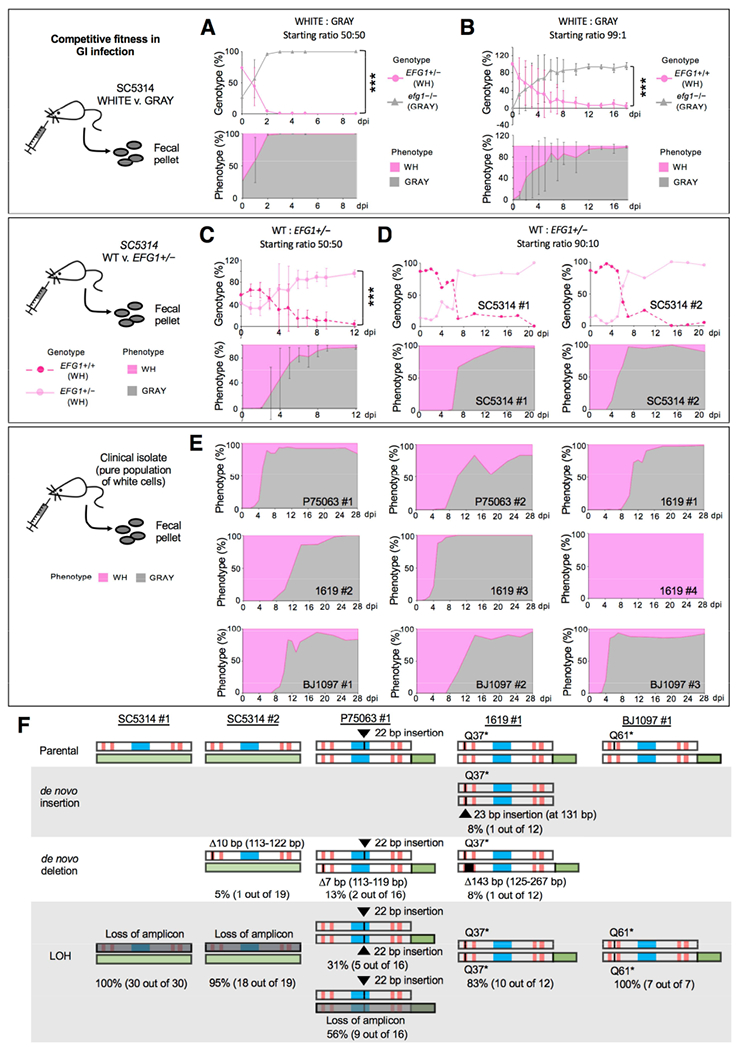
Figure 4. MTLa/α gray cells exhibit a fitness advantage over white cells in a commensal GI model.

(A) Competition between SC5314 white (EFG1+/−) and gray (efg1−/−) states in a GI model. Cell types were co-inoculated 50:50 and analyzed upon recovery from fecal pellets. NATR v. NATS analysis was used to define strain type (genotype) and colony color used to define the phenotype. Strains are CAY7768/7065. n=3 cohoused mice. Mean values with SD. ***, P<0.001 by t test.
(B) Competition between SC5314 white (EFG1+/+) and gray (efg1−/−) cells inoculated in a 99:1 ratio (CAY8282 and 7769). n=3 mice housed separately. Mean values plotted with SD. ***, P<0.001 by t test.
(C) A 50:50 competition between SC5314 EFG1+/+ and EFG1+/− cells (both in the white state) in the GI model (Strains CAY7770 and 7064). n=3 cohoused mice. Mean values with SD. ***, P<0.001 by t test.
(D) A 90:10 competition between EFG1+/+ and EFG1+/− cells (strains CAY8282 and 7768). n=2 mice housed separately.
(E) Strains P75073, 1619, and BJ1097 (naturally EFG1+/−) were evaluated for GI colonization. Cells were introduced in the white state and recovered from fecal pellets. Strains with GFP-tagged EFG1 (CAY9159/9165/9195) or wildtype isolates were used. n=9 independent experiments with mice housed separately.
(F) Summary of EFG1 mutations arising during white-to-gray switching in the GI model. Genotypes examined by PCR and Sanger sequencing to determine mutations in EFG1.
See also Figure S5.
