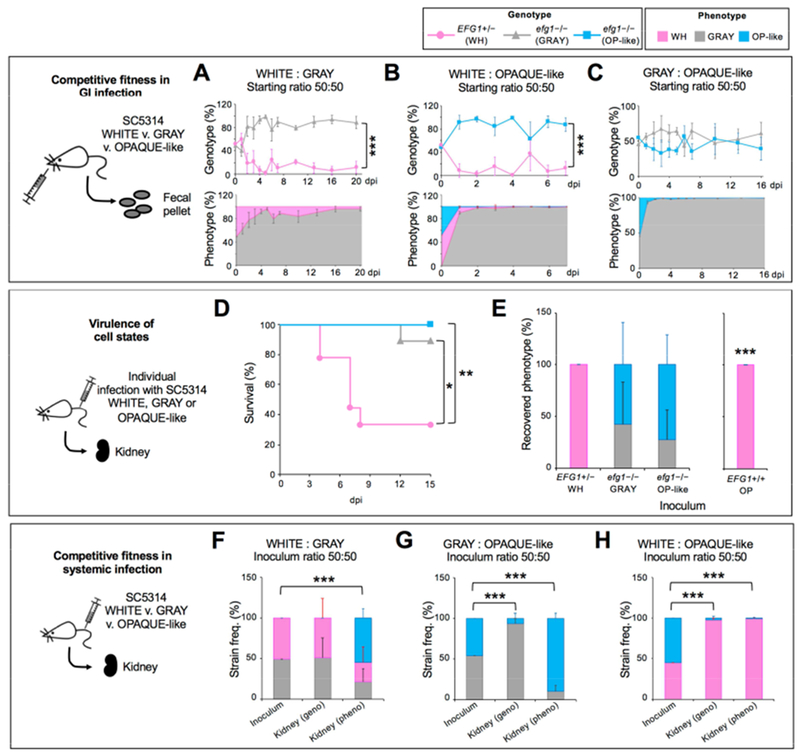
Figure 6. Comparison of different MTLa/a cell states in infection.

(A) Competitive fitness of C. albicans MTLa/a cells in a disseminated infection model. A 50:50 mix of white EFG1+/− and gray efg1−/− cells were co-inoculated in the GI (CAY6970/7869). Cells analyzed from fecal pellets. n=3 mice. ***, P<0.001 by t test.
(B) A 50:50 mix of white EFG1+/− and opaque-like efg1−/− cells were co-inoculated in the GI (CAY6970/7868) and cells analyzed from fecal pellets. n=4 mice. ***, P<0.001 by t test.
(C) A 50:50 mix of gray efg1−/− and opaque-like efg1−/− cells were co-inoculated in the GI (CAY7022/7868) and cells analyzed from fecal pellets. n=3 mice. ***, P<0.001 by t test.
(D) Kaplan-Meier survival curves comparing white, gray and opaque-like cells (CAY6970/7022/7023). *, P <0.05 and **, P <0.005 by log-rank test. n=9 mice each.
(E) Phenotypes of cells recovered from the kidney at 15 dpi (or when moribund) for EFG1+/− and efg1−/− strains and 3 dpi for EFG1+/+ isolate. n=7 mice for EFG1+/− and efg1−/− strains and n=4 mice for the EFG1+/+ isolate. Error bars, SD. ***, P<0.001 by t test compared to the inoculum.
(F) Competitive fitness of C. albicans cells in a disseminated model. A 50:50 mix of white EFG1+/− and gray efg1−/− cells (CAY6970/7869) were co-inoculated in the tail vein and recovered 7 dpi from the kidney. n=4 mice. ***, P<0.001 by t test.
(G) A 50:50 mix of gray efg1−/− and opaque-like efg1−/− cells (CAY7022/7868) were co-inoculated in the tail vein and recovered 7 dpi from the kidney. n=3 mice. ***, P<0.001 by t test.
(H) A 50:50 mix of white EFG1+/− and opaque-like efg1−/− cells (CAY6970/7868) were co-inoculated into the tail vein and recovered 7 dpi from the kidney. n=5 mice. ***, P<0.001 by t test.
