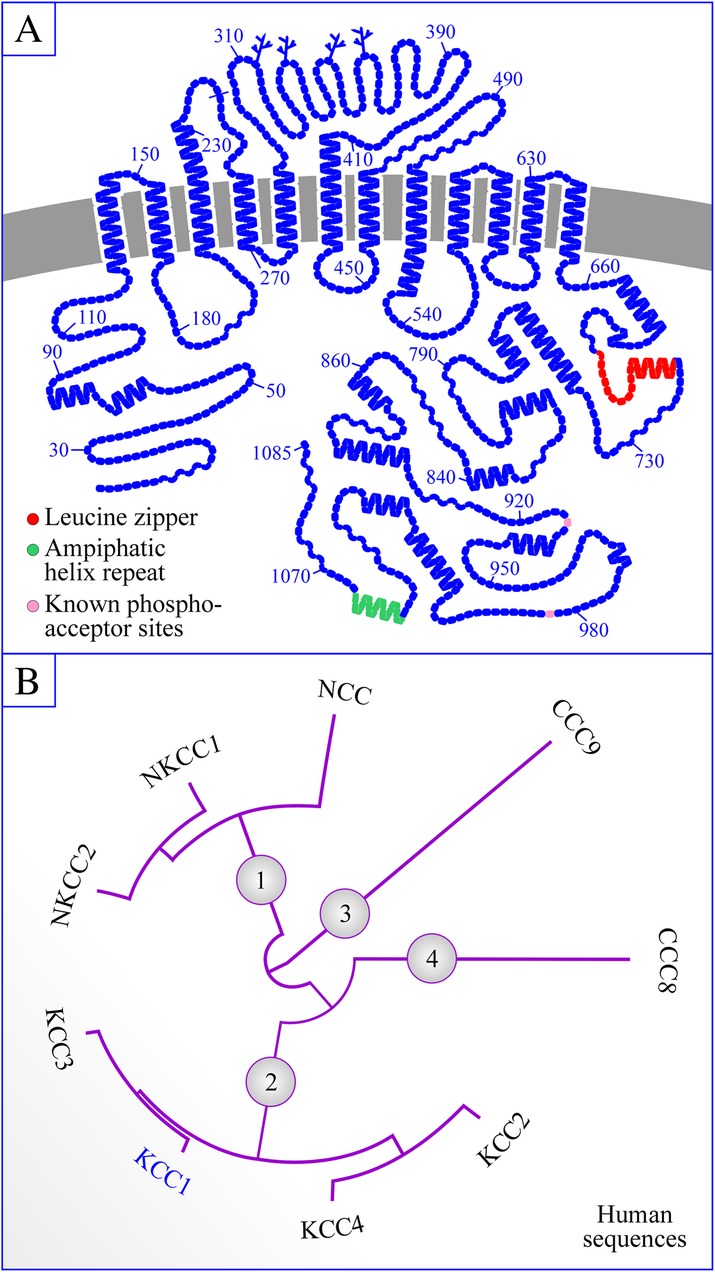
Fig. 1.

Structure of KCC1 and classification of the CCC family. a Structure. The topology model shown was drawn with the program PLOT by Biff Forbush (Yale University). Branched lines correspond to glycosylation sites, other symbols to residues and colors other than blue, to functional sites of potential importance. b Phylogenetic tree of the CCC family. The phylogram shown was obtained with the programs PhyML v3.1/3.0 aLRT and MUSCLE v3.8.31 [36, 37] using the most abundant human variants. GenBank accession numbers are provided in footnote 11
