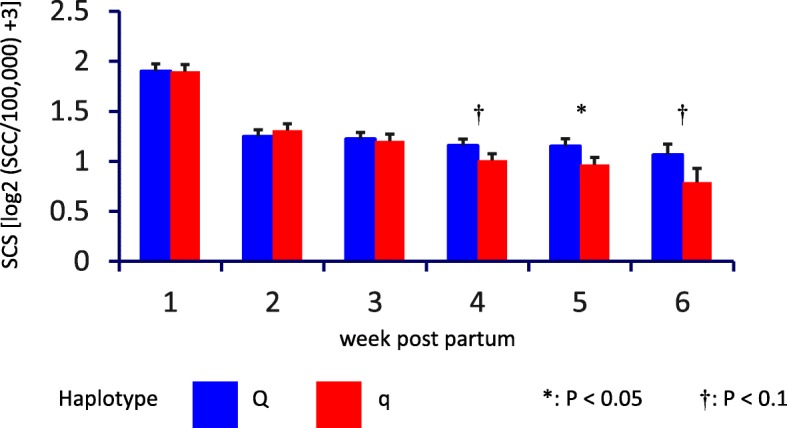
Fig. 3.

Proportion of udder quarters with extremely low somatic cell count in the Q and q groups for the FBN (week 2 to 6 p.p., difference between Q and q group P < 0.05) and TiHo cohort (week 5 p.p., difference between Q and q group P < 0.01)

Proportion of udder quarters with extremely low somatic cell count in the Q and q groups for the FBN (week 2 to 6 p.p., difference between Q and q group P < 0.05) and TiHo cohort (week 5 p.p., difference between Q and q group P < 0.01)