. 2019 Jun 5;10(27):6651–6660. doi: 10.1039/c9sc01441a

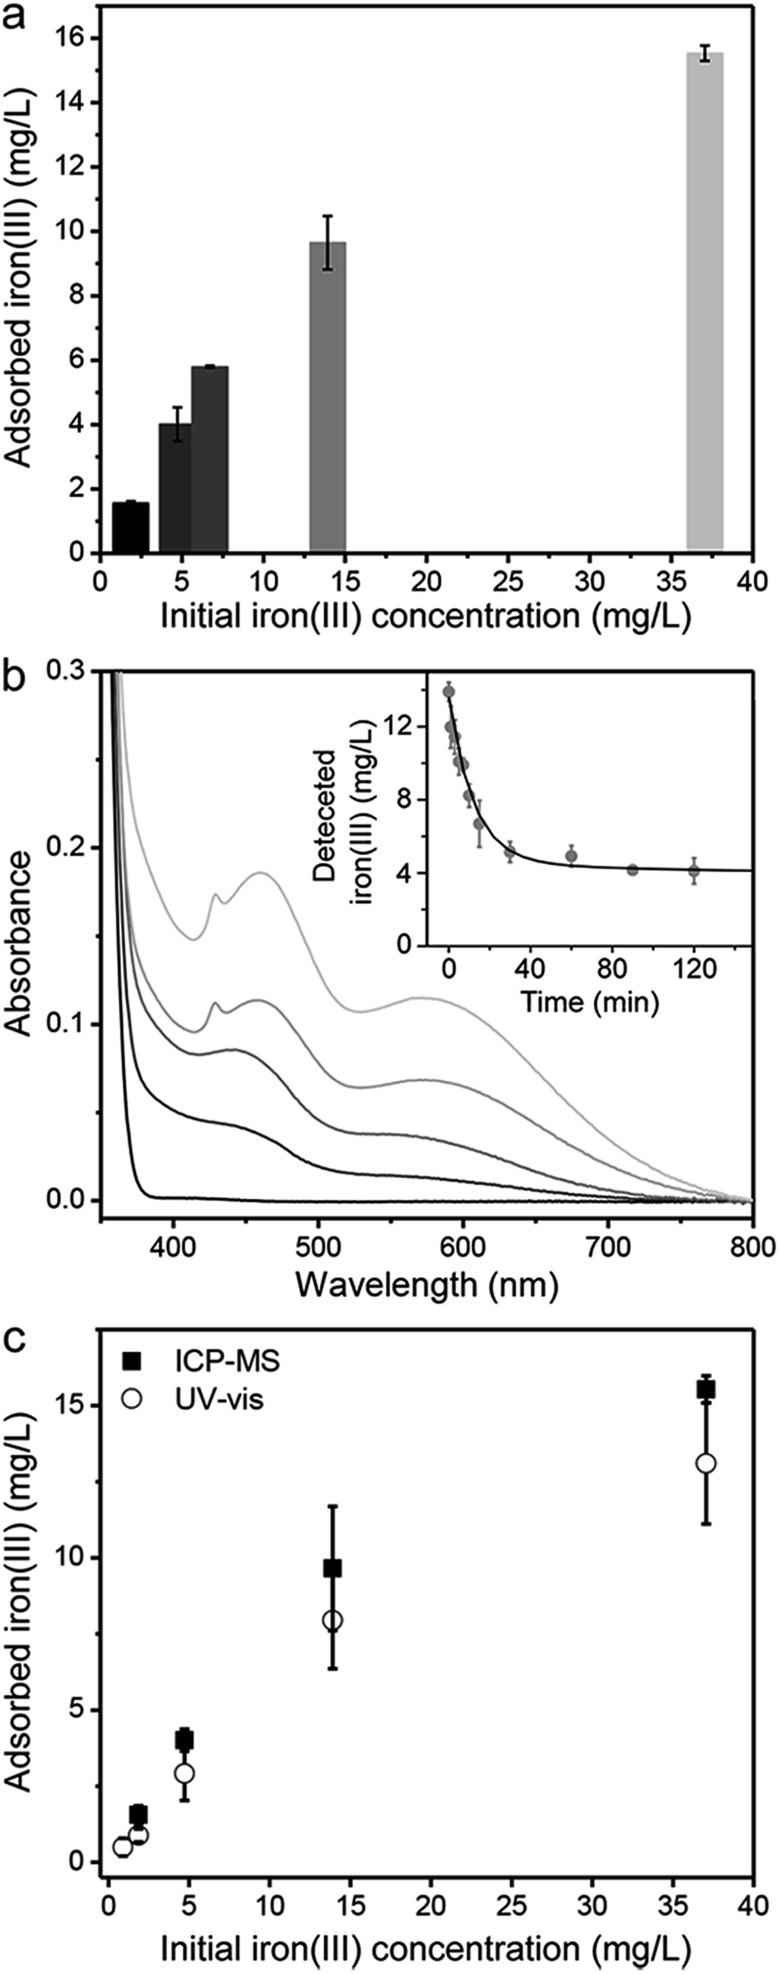
Fig. 5. (a) Adsorbed iron(iii) by PAF-1–ET in synthetic groundwater (initial iron concentrations were prepared as 1.8, 4.7, 6.7, and 37 mg L–1 using (NH4)2Fe(SO4)2 and groundwater collected in West Bengal, India16 (iron(iii) concentration of 14 mg L–1). For each measurement, 5 mL of each water sample were combined with 5 mL of citric acid solution (10–15 mg mL–1) and 2 mg of PAF-1–ET. (b) Absorption spectra after 8-hydroxyquinoline addition to dried PAF-1–ET samples following exposure to the corresponding groundwater samples in (a); (inset) time-dependent uptake of iron(iii) from the genuine groundwater sample fit to a single exponential decay y = Aet/t0 + C (black line), yielding parameters A = 9.2(3) mg L–1, C = 4.1(1) mg L–1, and t0 = 12(1) min. (c) Comparison of direct iron(iii) measurements by ICP-MS (black squares) and calculated iron(iii) concentrations determined from the absorbance at 460 nm in the presence of 8-hydroxyquinoline indicator (open circles).

Fig. 5