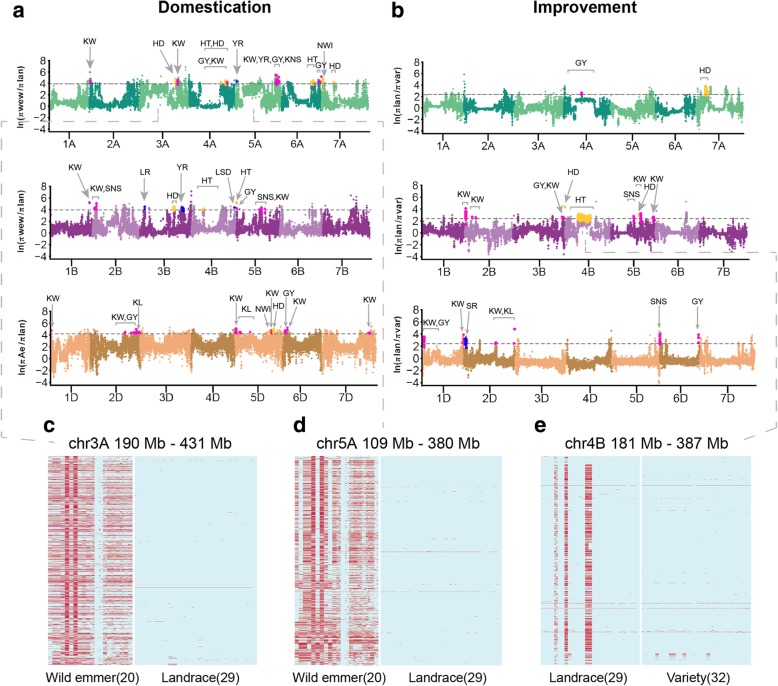
Fig. 5.
Genome-wide selective signals during domestication and improvement. Whole-genome screening of selective signals during domestication (a) and improvement (b). The ln π ratio values are plotted against the position on each of the 21 chromosomes. The horizontal gray dashed lines show the genome-wide threshold for selective sweeps, ln πwild emmer/πlandrace > 3.95, ln πAe. auschii/πlandrace > 4.29, and ln πlandrace/πvariety > 2.41. The previous reported QTLs that overlap with selection signals are highlighted with points in different colors, magenta for QTLs related to yield, blue for QTLs associated with disease resistance, and yellow for development related. All the windows overlapped with QTLs, and the QTLs indicate references and confidence intervals are provided in Additional file 9: Tables S15 and Additional file 10: S16. c–e The patterns of SNPs of the large regions with long stretches of elevated π ratio on chromosomes 3A, 5A, and 4B. Each column is an accession, and each row is an SNP site. Different colors donate the genotypes of SNPs, light blue for reference homozygous sites and red for homozygous non-reference sites

